




Research influences day-to-day decisions: what study methods students adopt, which programs schools expand, which health or policy claims people share, and which products get described as “evidence-based.”
The problem is not that research is useless. The problem is that research findings often get stretched. A headline turns an association into a cause. An abstract highlights one outcome and downplays others. A statistically significant result gets framed as a meaningful real-world improvement.
Evaluating research is a practical skill: you trace a claim back to the design, results, and uncertainty, then decide what the study can support.
This does not require advanced mathematics. It requires discipline about three layers:
-
What the authors did (methods)
-
What they found (results)
-
What they say it means (interpretation)
Reporting guidelines exist because missing details block evaluation. CONSORT, PRISMA, and STROBE define what readers should expect to see for trials, systematic reviews, and observational studies. When those details are absent, confidence drops, even if the conclusion sounds strong.
This guide gives you a workflow you can reuse for assignments, literature reviews, and everyday research claims: a fast scan to decide whether the paper deserves time, then deeper checks that catch common forms of weak evidence and overclaims.
This article is educational and does not provide medical, legal, or financial advice.
Table of Content
- Explain: Evidence, claims, and why overclaims happen
- Inform: A fast workflow for evaluating research
- Practical Insight: Deep checks that catch weak evidence
- Outcomes and Limitations: What your evaluation can conclude
- Conclusion
- FAQs
- Reference
Explain: Evidence, claims, and why overclaims happen

Data, evidence, and conclusion are not the same
Data are observations: exam scores, survey answers, lab measurements, interview transcripts. Evidence is what those data support after you consider design limits, bias risks, and uncertainty. A conclusion is a statement about meaning that goes beyond the measurements.
Overclaims often start when the conclusion drifts away from what the design can support. That drift can happen inside a paper, and it can get worse in summaries that remove detail.
What weak evidence looks like in practice
Weak evidence usually shows up as one or more of these issues:
-
Design mismatch: the design cannot test the claim (for example, a one-time survey used to argue cause).
-
Alternative explanations: confounding, selection bias, or measurement issues offer other reasons for the result.
-
Low precision: small samples, wide uncertainty, or heavy missing data reduce confidence.
-
Selective emphasis: only favorable outcomes, subgroups, or analyses get highlighted.
-
Incomplete reporting: key details are missing, blocking evaluation.
Frameworks and checklists used in evidence appraisal stress validity, credibility, and applicability rather than relying on reputation or a single number.
What an overclaim looks like in writing
Overclaims often appear as language patterns:
-
Causal verbs without causal design (“causes,” “leads to,” “results in”)
-
Broad generalization from narrow samples (one school, one city, one age group)
-
“Significant” treated as “important”
-
Recommendations framed as settled (“everyone should,” “this proves,” “this settles”)
The ASA warns against treating p-values as measures of importance or truth. Concerns about exaggerated claims tied to statistical thresholds have also been raised in broader scientific commentary.
Inform: A fast workflow for evaluating research
A good workflow saves time and reduces missed red flags. The three-pass reading method is a practical model: first pass for structure and relevance, second pass for understanding, third pass for deeper critique.
Step 1: Define the claim you are checking
Write the claim in one sentence, using the same strength and scope as the source:
-
What action or exposure is being discussed?
-
What outcome is being claimed?
-
Who is the claim about?
-
What setting and timeframe?
This keeps you from evaluating the wrong question. It also makes later notes easier.
Step 2: Identify the study design and its limits
Design is a boundary on what a study can support. Evidence hierarchies can be overused, yet they still remind readers that different designs answer different questions.
Randomized trials
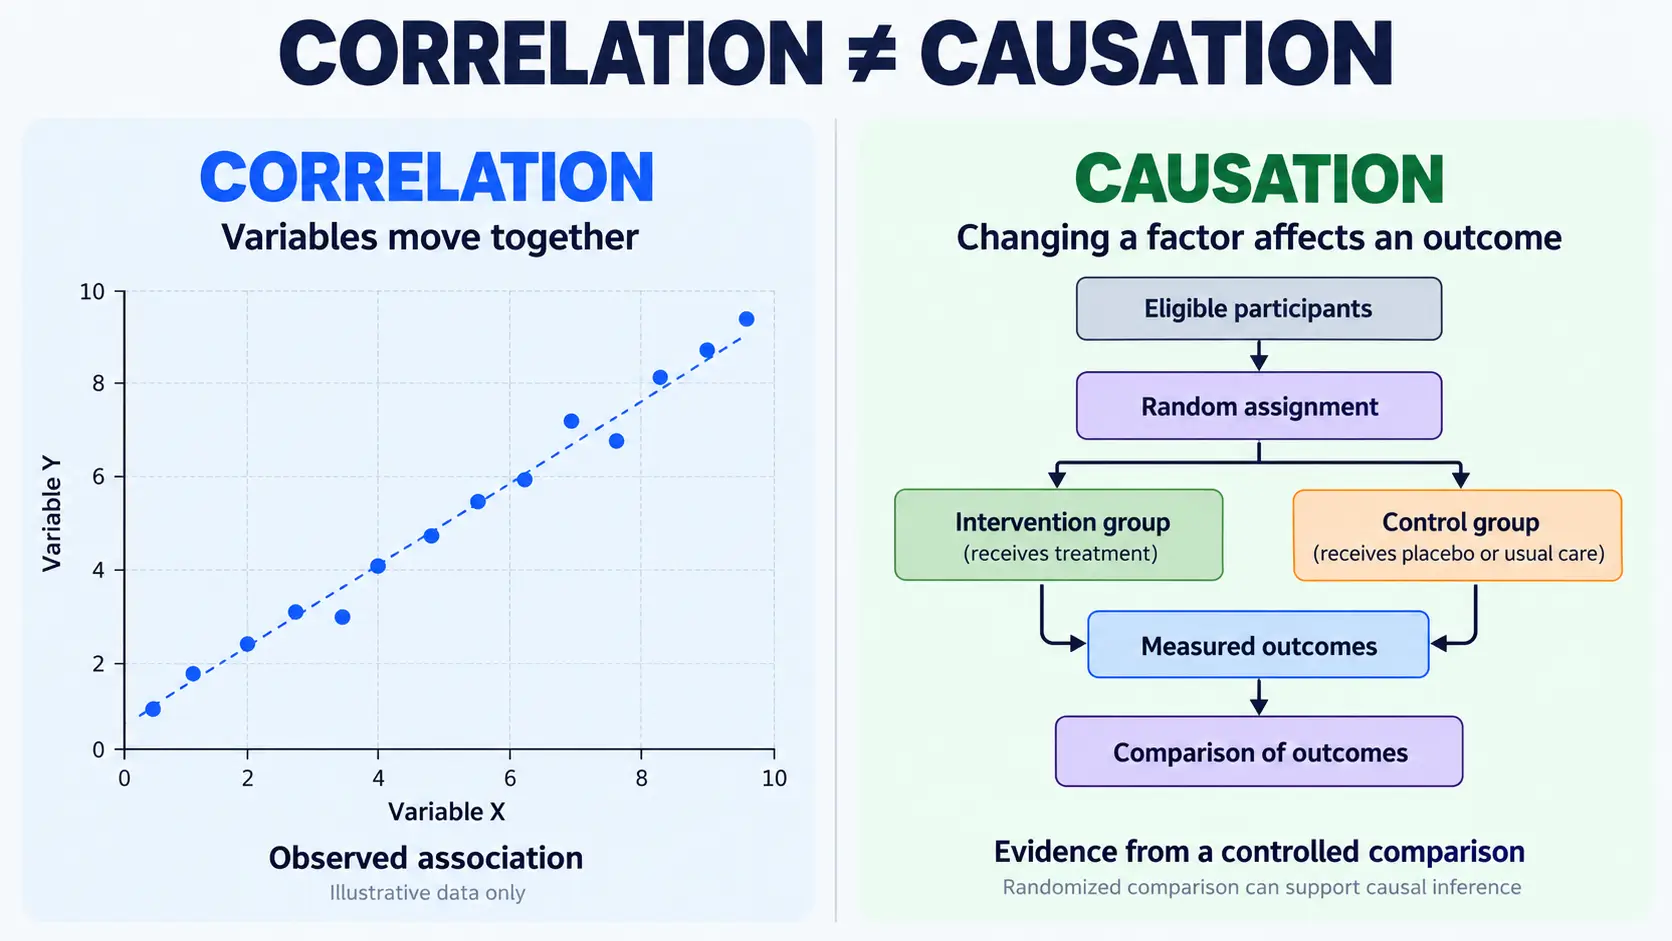
Randomized controlled trials compare groups assigned by a random process. When conducted and reported well, they support causal claims about the tested intervention in the studied population and setting.
Key checks:
-
Randomization described clearly
-
Outcome definitions and timing stated
-
Attrition and missing data reported
-
Consistent outcome measurement across groups
-
Outcomes reported as planned
CONSORT exists to improve reporting so readers can evaluate these elements.
Observational studies
Observational designs (cohort, case-control, cross-sectional) measure exposures and outcomes without random assignment. They often support association claims and risk-factor exploration.
Main limitation: confounding and selection can produce associations that look like effects. STROBE exists because readers need details on participant selection, variables, bias handling, and limits to generalization.
Systematic reviews and meta-analyses
Systematic reviews use explicit methods to find, select, and synthesize studies. Meta-analysis combines results when studies are comparable.
A systematic review can be strong evidence, yet it can also inherit the weaknesses of included studies or be biased by missing results. PRISMA focuses on transparent reporting of the search, selection, and synthesis process.
Cochrane guidance also describes how missing evidence and selective non-reporting can bias a synthesis.
Step 3: Scan for transparency and reporting quality
Before deep reading, check whether the paper gives enough information to evaluate.
Reporting guidelines (CONSORT, PRISMA, STROBE)
Reporting guidelines are not proof of quality, yet they set expectations for completeness. The EQUATOR Network hosts a large directory of reporting guidelines across study types.
Fast questions:
-
Does the paper define outcomes clearly?
-
Does it explain how participants were selected and measured?
-
Does it report what was planned vs what was added later?
Registration, protocols, and disclosures
Registration and protocols reduce selective awareness and outcome switching in areas like clinical trials. ICMJE’s trial registration statement explains this policy goal.
Disclosures matter for trust and interpretation. ICMJE provides standardized disclosure guidance and forms to support consistent reporting of relationships and activities that may influence perception.
Preprints vs peer-reviewed articles
Preprints can circulate before journal peer review. The NIH Preprint Pilot describes an approach to increasing discoverability of NIH-funded preprints in PMC and PubMed while keeping their status clear.
Practical reading implication: treat preprints as preliminary, and lean harder on design clarity, transparency, and cautious interpretation.
Practical Insight: Deep checks that catch weak evidence
Validity checks: bias, confounding, and measurement
Risk of bias domains (plain-language version)
Bias is a systematic problem that shifts results away from what the study aims to estimate. RoB 2 is a structured tool that organizes bias into domains and uses signaling questions to guide judgments.
You can translate that structure into reader questions:
-
Group comparability: Were groups similar before the intervention?
-
Deviations: Did participants receive what was intended, and is that handled clearly?
-
Missing outcomes: How much data is missing, and is the handling plausible?
-
Measurement: Were outcomes measured the same way across groups?
-
Reporting: Do reported outcomes match what the methods promised?
If key information is missing, lower your confidence rather than filling gaps with assumptions.
Confounding and selection issues in observational studies
In observational studies, confounding is a common alternative explanation: a third factor relates to both the exposure and the outcome.
Example pattern: a study reports that students using a study app have higher grades. Motivation, prior achievement, tutoring access, or time availability may differ between users and non-users, and those differences can explain the association. A strong observational paper measures likely confounders, explains selection, and tests robustness.
STROBE’s checklist focus on participants, variables, bias, and generalizability reflects these needs.
Measurement quality: outcomes and instruments
Weak evidence often hides inside measurement:
-
Vague outcomes (“success,” “improvement”) without a defined metric
-
Unvalidated questionnaires used as if they were precise instruments
-
Outcomes measured at different times across groups
-
Self-report measures treated as equivalent to objective measures without discussion
Transparent outcome definitions and measurement methods make evaluation possible. Reporting guidelines push studies toward that clarity.
Results checks: magnitude, precision, and selective emphasis
P-values vs effect size and uncertainty
A p-value is widely reported, yet it does not measure effect size or practical importance, and it does not give the probability a claim is true.
When evaluating results, look for:
-
Effect size: how large is the difference or association?
-
Precision: how wide is the uncertainty (confidence intervals are common)
-
Practical meaning: does the effect matter in the real setting?
Debates about overreliance on statistical significance highlight how threshold thinking can distort interpretation and incentives.
Multiple comparisons and subgroup claims
When researchers test many outcomes, subgroups, or analytic choices, some statistically significant findings can appear by chance. Strong papers reduce this risk by:
-
Declaring primary outcomes
-
Treating subgroup findings as exploratory unless planned and powered
-
Reporting results comprehensively rather than spotlighting one favorable analysis
Concerns about selective interpretation and exaggerated certainty are part of the broader critique of “significance-only” reading.
Relative vs absolute change in outcomes
Framing can inflate perceived impact:
-
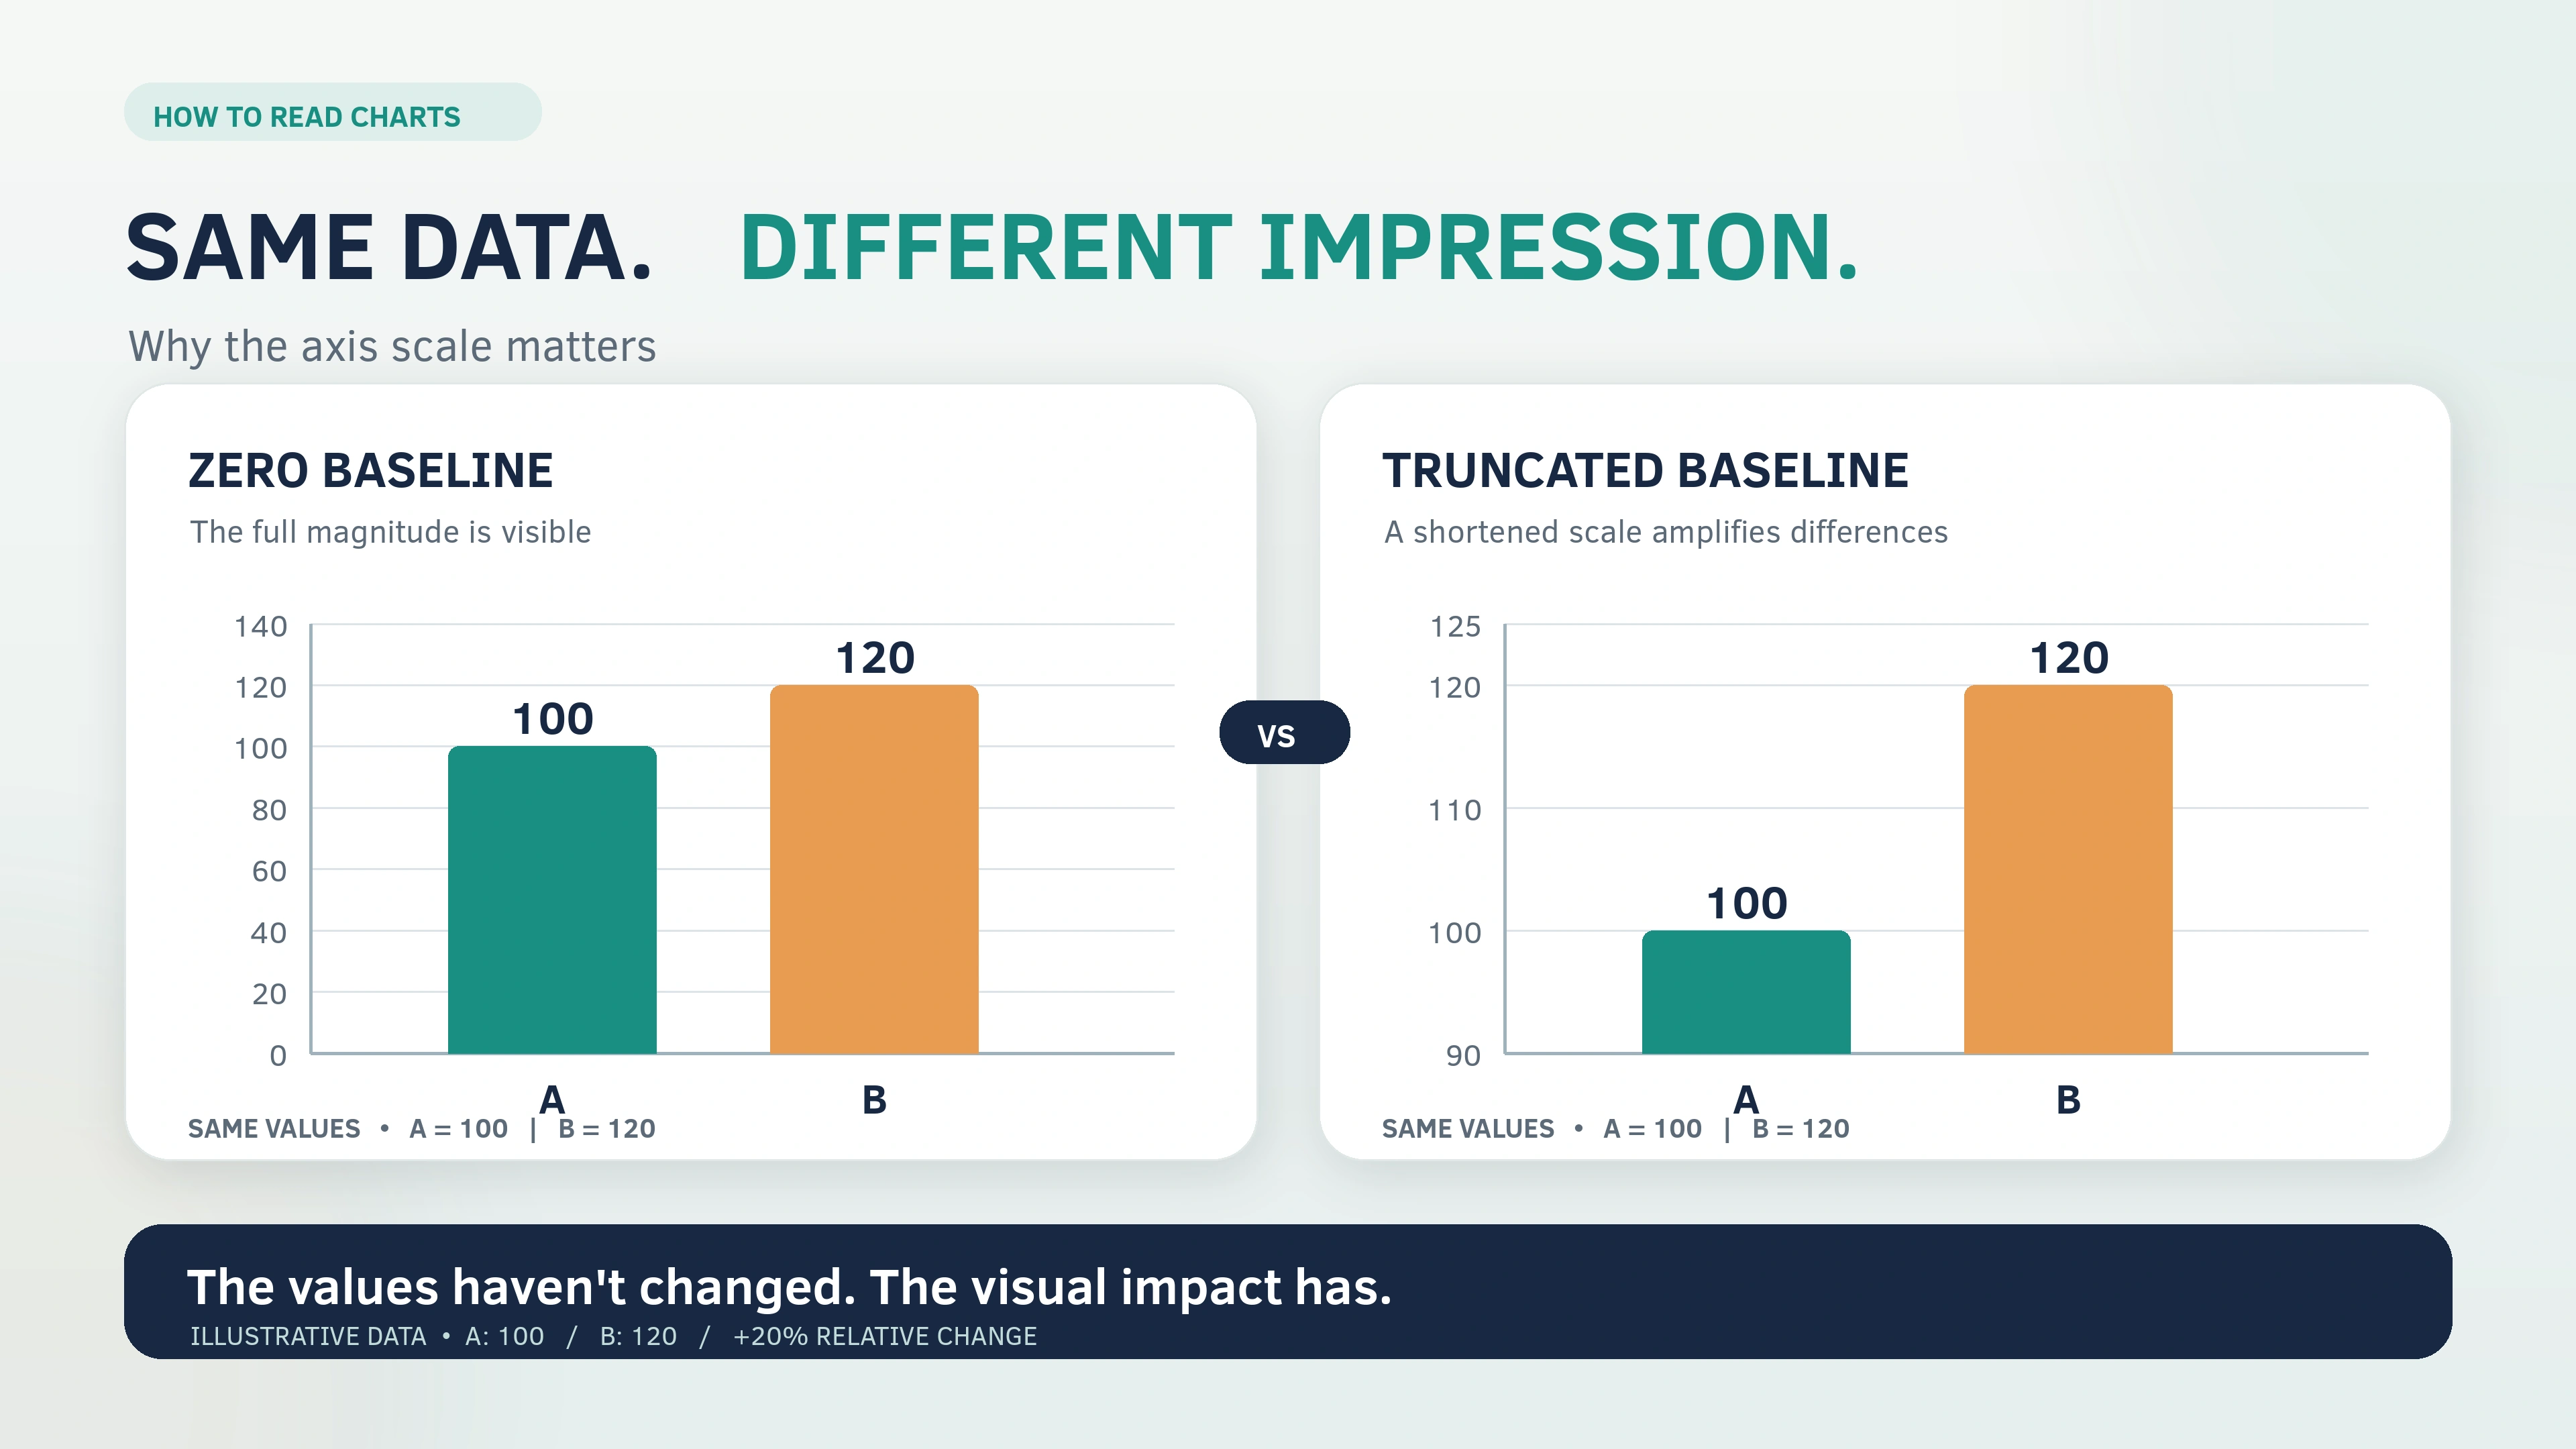
Relative change can sound large even when the absolute change is small.
-
Percentage language can hide baseline levels.
When papers report both absolute and relative measures, interpretation is easier. When they do not, track down the underlying numbers before accepting a strong practical claim.
Interpretation checks: language, scope, and generalization
Correlation wording vs causal wording
Match verbs to design. Observational evidence fits “is associated with,” “is linked to,” or “correlates with.” Causal verbs require stronger causal support.
A common overclaim is causal language layered onto correlational designs, then repeated in summaries that omit the design limits.
Generalizing beyond the sample and setting
Ask “Who was studied?” and “Where did this happen?”
-
One school vs multiple schools
-
One region vs multiple regions
-
One age group vs multiple age groups
-
Volunteers vs representative samples
A conclusion aligned with evidence stays close to the sample and setting unless the study design supports wider generalization.
Recommendation claims that exceed the evidence
Some papers end with recommendations that sound settled. Evidence certainty and decision-making strength are not identical. In health evidence synthesis, GRADE explicitly separates certainty of evidence from how conclusions are presented in “Summary of findings” tables.
Even outside health topics, the same principle applies: a study can be informative while still being insufficient for a broad policy or product claim.
Worked examples you can reuse
These scenarios are simplified so you can practice mapping claim strength to design support.
Example 1: Study habits and exam scores
Scenario: A cross-sectional survey finds that students reporting eight hours of sleep score higher on exams. A summary says: “Sleeping eight hours boosts exam scores.”
Apply the workflow:
-
Define the claim
-
“More sleep raises exam scores.”
-
Identify the design
-
Cross-sectional survey → observational association.
-
Check design limits
-
The study supports: “Sleep duration is associated with exam scores in this sample.”
-
The study does not test cause on its own.
-
Check confounding and measurement
-
Sleep is self-reported: measurement error risk.
-
Confounders: stress, prior achievement, study time, health, responsibilities.
-
Check wording
-
“Boosts” is a causal verb. For this design, “associated with” fits better.
Evidence note example:
-
“Association only; causal wording exceeds design. Useful as a hypothesis signal; stronger evidence needs longitudinal or intervention designs.”
Example 2: A school program evaluation
Scenario: A school pilots a tutoring program for one term and reports improved scores. A newsletter says: “The program works and should expand everywhere.”
Apply the workflow:
-
Define the claim
-
“The program caused score gains and will work in other schools.”
-
Identify the comparison
-
Was there a control group? Was assignment random?
-
Check bias and measurement
-
If no comparison group, other explanations exist (different test difficulty, teaching changes, cohort differences).
-
If there was random assignment, look for clear reporting of allocation, attrition, and outcomes. CONSORT-based reporting cues can guide what to look for in trials.
-
Check generalization
-
One school pilot often reflects local staffing and scheduling conditions.
Evidence note example:
-
“Promising local results. Evidence supports ‘worked in this setting’ more than ‘works everywhere.’ Confidence depends on the comparison design and outcome measurement quality.”
Outcomes and Limitations: What your evaluation can conclude
A short certainty rating you can write down
A simple rating keeps your evaluation usable. Evidence synthesis frameworks rate certainty using concepts such as risk of bias, inconsistency, indirectness, imprecision, and publication bias.
You can write one of these after reading:
-
Higher confidence: design fits the claim; reporting is complete; uncertainty is reasonable; key alternative explanations addressed.
-
Moderate confidence: design fits part of the claim; some uncertainty or missing detail; conclusions stay cautious.
-
Lower confidence: design does not fit the claim; key details missing; strong causal language without support; selective emphasis.
When a single study is informative
One study can be informative when the design fits the claim, reporting is clear, and results align with a wider pattern of evidence. That said, single-study confidence often drops when bias risks or selective reporting pressures are high.
Work on research reliability and bias has highlighted how field practices influence the chance that a published claim holds up over time.
When to look for a synthesis
Look for systematic reviews when:
-
Many small studies exist with mixed results
-
The question has high stakes
-
You suspect publication bias or selective reporting
-
You need a summary grounded in transparent selection rules
PRISMA supports transparency in how reviews locate and select studies.
Cochrane guidance also explains how missing results can bias a meta-analysis and how review authors assess that risk.
Conclusion
Evaluating research comes down to alignment: claim strength must match study design, reporting detail, and the size and precision of results. A fast scan keeps attention on papers that report enough information to evaluate. A deeper check focuses on bias, confounding, measurement quality, selective emphasis, and interpretation drift, including the shift from association to causal language.
A simple practice can raise consistency: after each paper, write a short evidence note with (1) what the study supports, (2) what it does not support, and (3) what evidence would raise confidence, such as replication, a stronger design, or a systematic review.
FAQs
Is peer review enough to trust a study?
Peer review can improve clarity and catch problems, yet it does not remove design limits or guarantee complete reporting. Use the same design, transparency, and interpretation checks for peer-reviewed papers and preprints.
What is a fast way to spot an overclaim?
Compare the conclusion’s verbs to the design. Causal verbs paired with observational designs signal a mismatch.
What do p-values tell me when I read a paper?
A p-value is a statement about data under a statistical model. It does not measure effect size or importance, and it does not give the probability that a claim is true.
Why do systematic reviews often carry more weight than a single study?
They use explicit methods to find and synthesize multiple studies. Their credibility still depends on the quality of included studies and the handling of missing evidence.
How should I treat a preprint?
Treat it as preliminary work that has not completed journal peer review. Focus on design clarity, transparent reporting, and cautious conclusions.
Reference
-
American Statistical Association. Statement on Statistical Significance and P-Values. 2016.
-
Hopewell S, et al. CONSORT 2025 statement: updated guideline for reporting randomised trials. BMJ. 2025.
-
Schulz KF, Altman DG, Moher D, et al. CONSORT 2010 Statement. BMJ. 2010.
-
Moher D, et al. CONSORT 2010 Explanation and Elaboration. BMJ. 2010.
-
Page MJ, McKenzie JE, Bossuyt PM, et al. PRISMA 2020 statement. BMJ. 2021.
-
von Elm E, Altman DG, Egger M, et al. STROBE Statement. PLOS Medicine. 2007.
-
EQUATOR Network. Reporting guidelines database/directory.
-
Cochrane Methods (Bias). RoB 2: revised Cochrane risk-of-bias tool for randomized trials.
-
Sterne JAC, Savović J, Page MJ, et al. RoB 2: a revised tool for assessing risk of bias in randomised trials. BMJ. 2019.
-
Cochrane Handbook for Systematic Reviews of Interventions. Chapter 13: Assessing risk of bias due to missing evidence.
-
Cochrane Handbook for Systematic Reviews of Interventions. Chapter 14: Summary of findings tables and grading certainty (GRADE).
-
International Committee of Medical Journal Editors. Clinical Trial Registration: A Statement from the ICMJE. 2004.
-
International Committee of Medical Journal Editors. Disclosure of Interest. Updated February 2021.
-
Committee on Publication Ethics (COPE). Predatory publishing: discussion document. 2019.
-
Amrhein V, Greenland S, McShane B. Scientists rise up against statistical significance. Nature. 2019.
-
Ioannidis JPA. Why Most Published Research Findings Are False. PLOS Medicine. 2005.
-
Oxford Centre for Evidence-Based Medicine. 2011 Levels of Evidence.
-
National Library of Medicine (PMC). NIH Preprint Pilot. 2025.
-
Keshav S. How to Read a Paper. ACM SIGCOMM Computer Communication Review. 2007.
-
NSW Department of Communities and Justice (FACSIAR). How do I assess the quality of research evidence? August 2020.
-
CASP (Critical Appraisal Skills Programme). CASP Checklists.
-
Joanna Briggs Institute. Critical Appraisal Tools.
-
Centre for Evidence-Based Medicine (Oxford). Critical Appraisal Tools.





Comments 0
No comments yet. Be the first to start the conversation.