




Data is no longer something only scientists, analysts, or big tech companies deal with. It shows up in homework graphs, sports stats, weather apps, school surveys, workplace dashboards, and headlines arguing for or against a policy. In a world like that, the real risk isn’t “not being a data person.” The risk is letting numbers decide for you—because you don’t feel confident enough to question them.
Data literacy is the set of skills that helps you stay in control. It helps you read charts without getting tricked by design choices, understand what a percentage actually refers to, and spot when a claim is missing context. It also helps you use data responsibly—because using data well isn’t just about being accurate; it’s also about being fair and ethical.
This article explains what data literacy is, why it matters so much in the 21st century, and how you can build it step by step.
Table of Content
- What data literacy means
- Data literacy vs. statistical literacy vs. information literacy
- Why data literacy matters now
- Core concepts everyone should know
- A practical roadmap to build data literacy
- Outcomes and limits
- Conclusion
- FAQs
What data literacy means
There isn’t one single definition used everywhere, but the most useful definitions agree on the core idea: data literacy is about making meaning from data and communicating that meaning clearly.
Statistics Canada describes data literacy as “the ability to derive meaningful information from data,” and connects it to reading, analyzing, interpreting, visualizing, and communicating data for decisions.
A UN Statistics Division presentation similarly emphasizes that it’s not just reading numbers, but finding meaning in them and deriving useful information.
A widely used industry phrasing defines it as the ability to “explore, understand, and communicate with data in a meaningful way.”
Put simply:
Data literacy is the ability to find, interpret, evaluate, and communicate with data—while understanding limitations, uncertainty, and ethical responsibilities.
Data literacy vs. statistical literacy vs. information literacy
These terms overlap, but they’re not identical:
-
Data literacy often includes working with charts, tables, datasets, tools, and basic data management (like tracking sources and definitions).
-
Statistical literacy focuses more on reasoning with statistics—like understanding variability, uncertainty, and what a result can actually justify. The Office for Statistics Regulation notes there’s no single consensus definition, which is part of why the term is used in different ways.
-
Information literacy focuses on how people find, evaluate, and use information sources. The ACRL Framework highlights ideas like “Authority Is Constructed and Contextual” and “Research as Inquiry,” which matter when deciding whether a dataset or claim is trustworthy.
A helpful way to think about it:
-
Information literacy helps you judge sources and credibility.
-
Statistical literacy helps you judge numerical reasoning.
-
Data literacy connects both to real datasets and real decisions.
Why data literacy matters now
Data is shaping school, work, and everyday decisions
Data literacy isn’t only for STEM pathways. Students meet data in science labs, social studies trends, surveys, and research projects. In many workplaces, people are expected to interpret dashboards, compare performance measures, or explain results to others—even if their job title has nothing to do with “data.” Statistics Canada’s data literacy materials emphasize a broad set of competencies, from interpretation to stewardship and ethics.
Misinformation and disinformation are a real, persistent risk
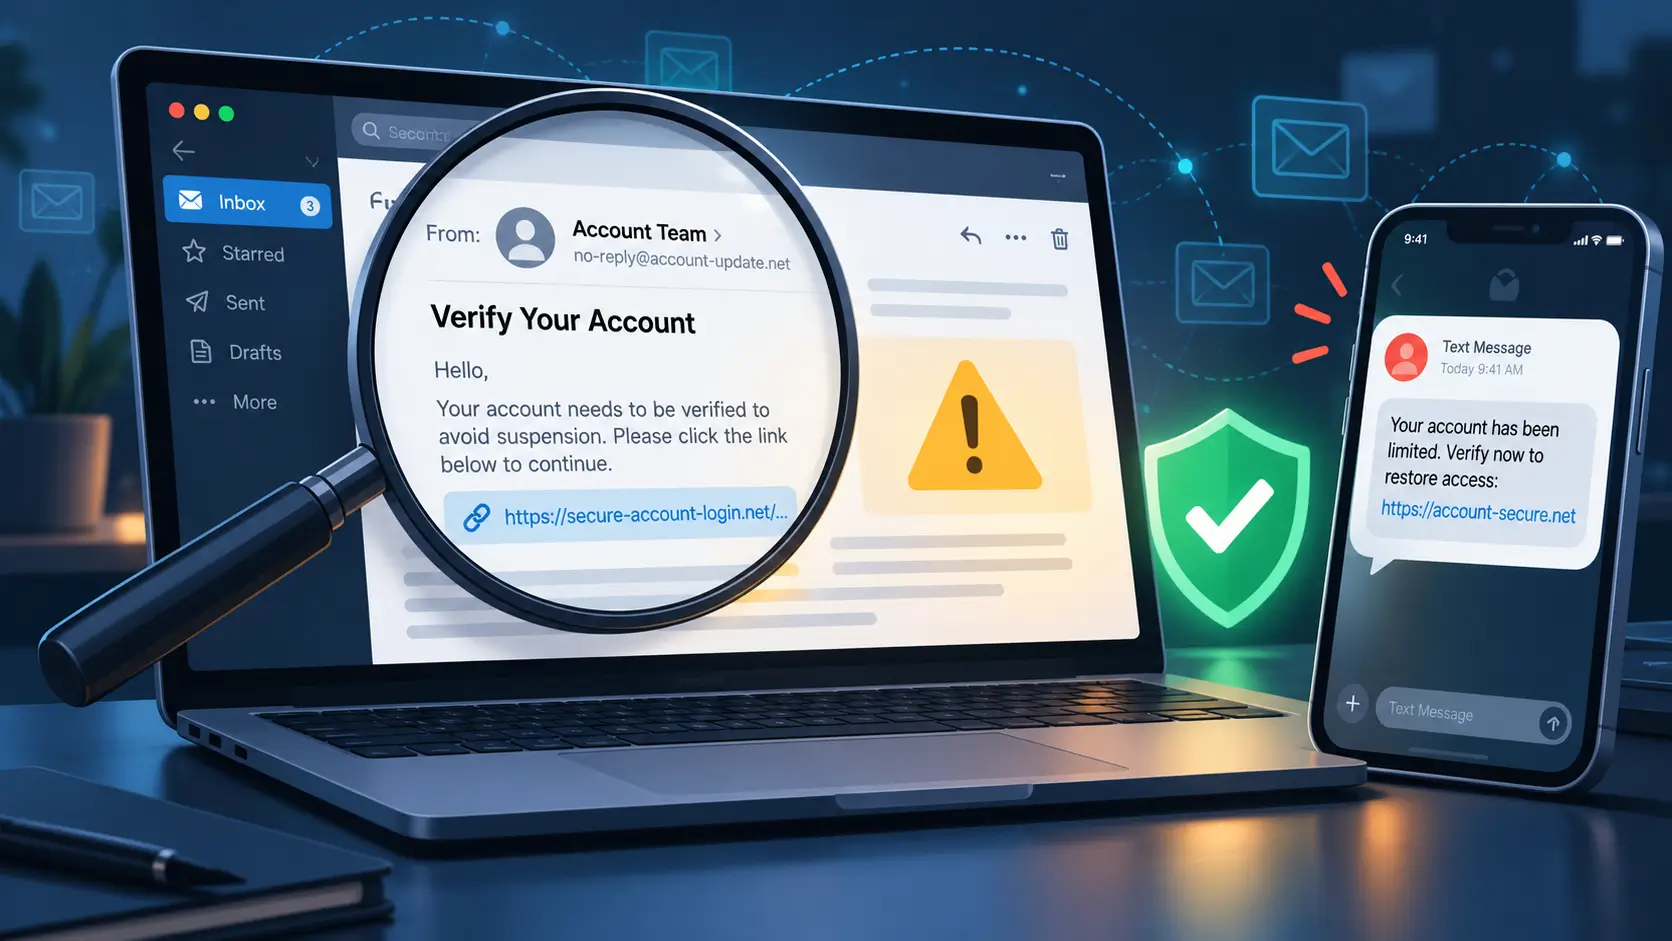
One reason data literacy is so urgent is that numbers and charts are persuasive—even when they’re misleading.
The World Economic Forum’s Global Risks Report 2024 ranked misinformation and disinformation as the biggest short-term risk (over a two-year horizon).
In the 2026 edition, misinformation and disinformation remained near the top—ranked 2nd in the two-year outlook.
Data literacy helps you pause and ask: “What does this number actually measure?” and “What’s missing?”
Data literacy is becoming part of “basic digital competence”
The Digital Competence Framework for Citizens (DigComp 2.2) groups digital competence into five areas, including “Information and data literacy.” That’s a big signal: these skills are treated as a baseline for modern life, not a specialty.
UNESCO’s work on Media and Information Literacy (MIL) also emphasizes critical engagement with information and safer navigation of the online environment—goals that data literacy directly supports.
Core concepts everyone should know
You don’t need advanced math to become data literate. A lot of the most important thinking is about context and clarity.
1) Where the data came from
Before trusting a number, ask:
-
Who collected it?
-
How was it collected (survey, records, sensors, platform data)?
-
Who is included—and who might be missing?
-
When and where was it collected?
This matters because different collection methods create different kinds of limitations. Data gathering and interpretation are explicitly called out as competencies in major public-sector frameworks.
2) What the measure means (and what it doesn’t)
Many arguments fall apart because a measure is treated like a perfect truth.
Common pitfalls:
-
“Average” hides spread: two groups can share the same average but be very different.
-
Percent without a baseline: “up 50%” matters a lot more if it’s 2→3 than 200→300.
-
Counts without denominators: “1,000 cases” means little without “out of how many.”
3) Uncertainty and limitations
Good data communication includes limits. Even official statistics can involve revisions, definitions, missing values, or measurement error.
The World Development Report 2021 stresses that data governance systems are still developing, and that societies need arrangements that enable beneficial use while safeguarding against misuse. That’s another way of saying: data is powerful, but it isn’t automatically safe or automatically reliable.
4) Correlation is not automatically causation
A classic mistake is seeing two things move together and assuming one caused the other.
A data-literate response is:
-
“These are associated. What else could explain it?”
-
“Did the cause happen before the effect?”
-
“Could a third factor be driving both?”
You don’t need to solve causal inference to become data literate—you just need to stop treating every pattern as proof.
5) How visuals can mislead
Charts are useful because they compress information quickly. But they can mislead through design choices.
Quick checks:
-
Axes: Is the y-axis cropped to exaggerate differences?
-
Units: Count, percent, rate—do you know which it is?
-
Time window: Is it cherry-picked?
-
Labels and source: Can you trace it back?
6) Ethics, privacy, and fairness
Data literacy includes ethical awareness. That means asking:
-
Was consent involved (if people’s data is included)?
-
Could this harm someone if shared or misinterpreted?
-
Does it reinforce unfair stereotypes?
-
Does it expose personal information, even indirectly?
UNESCO’s MIL framing emphasizes safer navigation online and building trust in the information ecosystem—goals that require ethics, not just technique.
A practical roadmap to build data literacy
The fastest way to improve is to practice small habits consistently.
Step 1: Learn to “trace” claims
Pick a chart you see online and try to trace it:
-
Can you find the original dataset or report?
-
Does the chart match what the source actually says?
-
Are definitions and time periods clear?
This is where information literacy and data literacy overlap: you’re judging authority, context, and evidence.
Step 2: Build chart-reading routines
Use a simple checklist:
CHART check
-
C: Claim — What is the chart trying to make you believe?
-
H: How measured — What exactly is counted or calculated?
-
A: Axes and units — Are scales and units clear and fair?
-
R: Range — What time period and group is included?
-
T: Traceable — Is there a source you can verify?
Step 3: Practice with small datasets
You don’t need huge data or fancy tools. A spreadsheet is enough.
Try these practice tasks:
-
Turn a small table into rates (per student, per 100 people, per day).
-
Make two visuals of the same data and write what each makes clearer.
-
Write a 5–7 sentence explanation that includes one limitation.
This aligns with how competencies are often described: interpretation, visualization, tools, and ethical use are all part of being “effective with data.”
Step 4: Learn “just enough” statistics to avoid common traps
Aim for confidence with:
-
Mean vs. median (when averages mislead)
-
Percent vs. percentage points
-
Rates and denominators
-
Basic variability (not every change is meaningful)
If you later choose deeper study (statistics, economics, research methods), these basics become a strong foundation rather than a barrier.
Step 5: Add ethics as a default, not an add-on
Before sharing results, ask:
-
Could this be misunderstood?
-
Have I hidden important context?
-
Am I protecting people’s privacy?
The World Bank’s WDR 2021 frames governance and safeguards as essential for turning data into benefits without creating harm.
Step 6: Choose learning pathways that match your goals
You can build data literacy through school courses, projects, clubs, short courses, certificates, or degrees. The key is quality and practice.
Quality signals to look for:
-
Clear learning outcomes (interpretation + communication, not only tool clicks)
-
Real assignments with feedback
-
Coverage of ethics, bias, and limitations
-
Transparent syllabus and assessment
If a program promises “become an expert fast” but avoids uncertainty, context, and ethics, that’s a warning sign—not a shortcut.
Outcomes and limits
What improves with stronger data literacy
With better data literacy, people tend to:
-
Interpret charts and tables more accurately
-
Ask better questions about claims and sources
-
Communicate findings more clearly (without overselling)
-
Make more responsible choices about using and sharing data
What data literacy can’t fix by itself
Data literacy helps, but it doesn’t magically solve:
-
Incentives to mislead (people can manipulate data on purpose)
-
Poor-quality data
-
Lack of access to trustworthy sources
-
Weak data governance systems
That’s why major reports emphasize both individual skills and system-level safeguards.
Conclusion
In the 21st century, being data literate is like being able to read well: it affects school, work, and how you understand the world. Frameworks such as DigComp treat “information and data literacy” as a core area of competence for citizens, and major global risk assessments continue to highlight misinformation and disinformation as top short-term threats—making critical data habits even more valuable.
You don’t need to become a statistician to start. Build the habit of tracing sources, checking denominators and time windows, reading charts carefully, and stating limitations honestly. Those skills make you harder to mislead—and better at using data to learn, decide, and communicate responsibly.
FAQs
What’s the simplest definition of data literacy?
Data literacy is the ability to derive meaningful information from data and communicate it responsibly.
Do I need advanced math to be data literate?
No. Many high-impact skills are basic: reading charts, understanding rates, checking denominators, and questioning claims.
How can I quickly tell if a chart is misleading?
Check axes and units, the time window, and whether you can trace it to a credible source.
How does data literacy help with misinformation?
Misinformation often uses numbers and visuals to persuade. Data literacy helps you test the claim instead of reacting to the presentation—especially important as global reports keep highlighting mis/disinformation as a major risk.
What should I look for in a data literacy course?
Look for practice-based assignments, feedback, coverage of ethics and limitations, and clear learning outcomes—not just tool tutorials.





Comments 0
No comments yet. Be the first to start the conversation.