


Geography, Federal Structure and Diversity
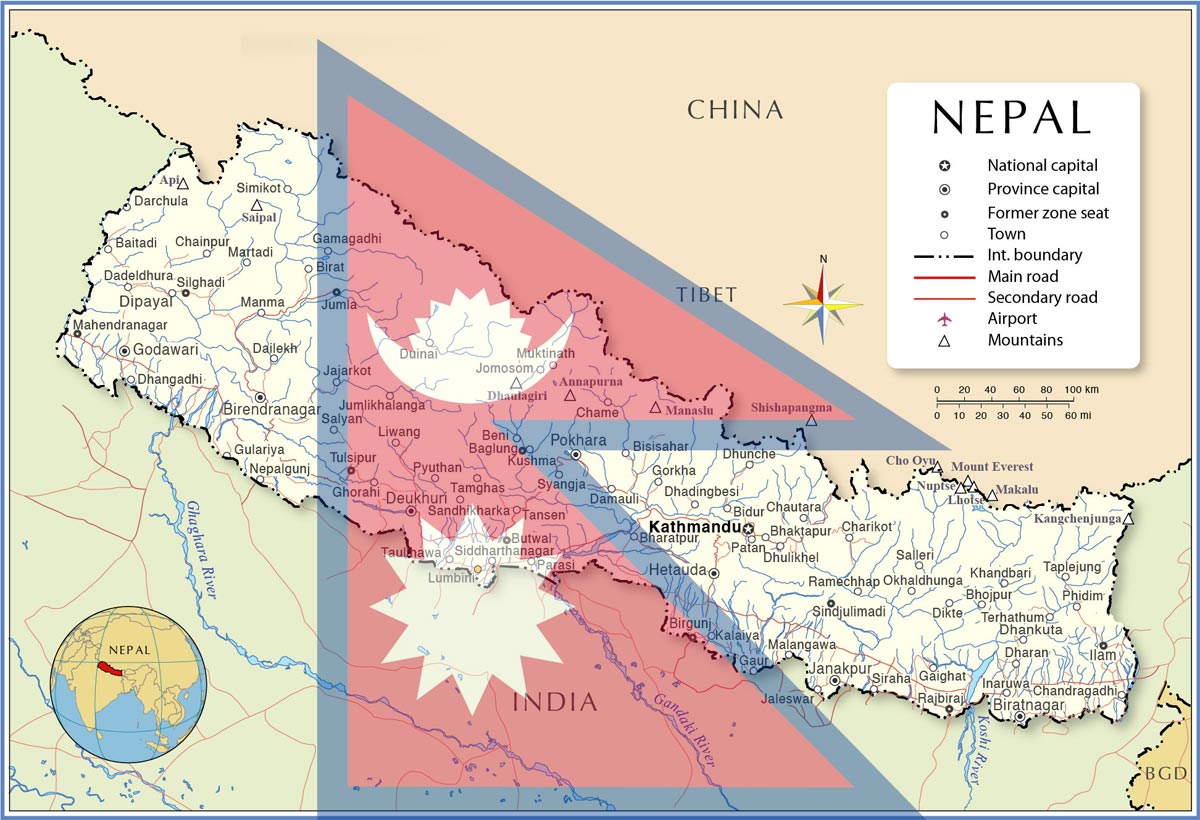
Nepal, naturally beautiful by its physical setting, is geographically spread across the Himalayan, Hill and Tarai (plains) regions. Extending from Mechi in the east to Mahakali in the west, federal Nepal is divided into seven provinces, 77 districts, 165 electoral constituencies and 753 local levels.
Within these local levels there are:
-
293 municipalities
-
460 rural municipalities
-
6,743 wards
Along with geographical diversity, the country also has social, cultural, ethnic, linguistic, political and religious diversity. This diversity is reflected in the varied lifestyles of Nepali people.
Implementation of various policies, plans and programmes adopted by the government has led to improvements in the living standards of Nepalis. Although the country has not progressed at the expected pace, many aspects of the economic and social sectors have improved.
To study and analyse different aspects of society in a factual manner, various government bodies have been producing economic and social statistics for the country through the use of censuses, surveys and administrative records.
Population Size and Distribution (Census 2078)
According to the National Population Census 2078, Nepal has a population of 29,164,578 living in 6,666,937 households. Of this total population:
-
Men: 14,253,551 (48.98 percent)
-
Women: 14,911,027 (51.02 percent)
Accordingly, the sex ratio is 95.59. The census results also show that the population of other gender is 2,928.
Looking at the distribution of population by province, the largest share of the total population, 20.97 percent, is in Bagmati Province. Similarly:
-
Madhesh Province: 20.97 percent
-
Lumbini Province: 17.56 percent
-
Koshi Province: 17.01 percent
-
Sudurpashchim Province: 9.24 percent
-
Gandaki Province: 8.46 percent
-
Karnali Province: 5.79 percent
Because Bagmati Province has 2,266 more people than Madhesh Province, Bagmati is regarded as having the largest population.
By type of local level:
-
Municipal areas: 66.17 percent of the population
-
Rural municipalities: 33.83 percent of the population
Nepal’s population density is 198 persons per square kilometre, and the average household size is 4.37 members.
Historical Censuses and Population Growth
Nepal’s first population census was conducted in 1968 B.S. The centenary of the census was reached in 2068 B.S. Most recently, the twelfth census was conducted in 2078 B.S.
According to the first census, the population of Nepal was 5,638,749. By the twelfth census, this figure had reached 29,164,578. This means that the population has increased by about 23.5 million compared to 1968 B.S.
Between 2068 and 2078 B.S., the population increased by 10.1 percent.
Geographic Distribution: Mountain, Hill and Tarai
Looking at population distribution by geographic region, the largest share of the population, 53.6 percent, lives in the Tarai. Similarly:
-
Hill region: 40.31 percent
-
Himalayan region: 6.08 percent
According to the 2068 B.S. census, the shares of population in Tarai, Hill and Himalayan regions were 50.3, 43.0 and 6.7 percent respectively.
According to the 2078 B.S. census results, 46.7 percent of the population lives in the Tarai. The share of the total population living in the Tarai is described as gradually increasing.
Population Growth Rate and Migration Patterns
According to the National Population Census 2078, the annual average population growth rate over the 10-year period is 0.92 percent. The annual average population growth rate during 2058–2068 B.S. was 1.35 percent, and during 2048–2058 B.S. it was 2.25 percent. The population growth rate in Nepal is gradually declining.
The decline in the population growth rate has occurred earlier than expected. In terms of the geographic distribution of population, the Tarai region has a higher share of population and experiences more intense migration. As a result, the population of the Himalayan and Hill regions has decreased.
Analysing the annual population growth rate of the 77 districts shows that 34 districts in the Himalayan and Hill regions have a negative growth rate, meaning that their population in 2078 B.S. is lower than in 2068 B.S. The highest population growth rate is in Bhaktapur at 3.35 percent, while the highest negative growth rate is in Ramechhap at -1.67 percent. In the 2068 B.S. census, 27 districts in the Himalayan and Hill regions had a negative population growth rate.
Age Structure and Demographic Dividend
Looking at Nepal’s population by age group, 61.96 percent of the population falls in the economically active working-age group of 15 to 59 years. According to the 2068 and 2058 B.S. censuses, this group accounted for 57 percent and 54 percent of the population respectively.
According to the 2078 B.S. census:
-
Children aged 0 to 14 years: 33.84 percent
-
Adolescents aged 16 to 24 years: 17.63 percent
-
Youth aged 16 to 40 years: 42.56 percent
-
Senior citizens aged 60 years or above: 10.21 percent
-
Population aged 65 years or above: 60.9 percent
It is necessary for the country to utilise this demographic dividend, characterised by the predominance of the active labour force, to promote economic and social development and achieve prosperity.
Dependency Ratio and Female-Headed Households
In the 2048 B.S. census, the dependency ratio was 67.2, while in the 2078 B.S. census it is 53.3. A declining dependency ratio is considered a favourable condition for economic development.
The dependency ratio is defined as the number of children (0 to 14 years) and elderly people (65 years or above) per every 100 people in the active age group (15 to 64 years).
According to the National Population Census 2078, 31.55 percent of households have a female household head. The highest share of female-headed households is in Gandaki Province at 41 percent, and the lowest is in Madhesh Province at 21.7 percent.
In the 2068 B.S. census, 25.73 percent of households had a female household head, and in the 2058 B.S. census, the share was 14.87 percent.
Caste and Ethnic Composition
According to the National Population Census 2078, there are currently 142 caste and ethnic groups living in Nepal, compared to 125 in 2068 B.S. Seventeen new caste and ethnic groups have been added this time.
Looking at population distribution by caste and ethnicity, the largest group is Chhetri, with a share of 16.45 percent. The next five largest groups are:
-
Hill Brahmin: 11.29 percent
-
Magar: 6.9 percent
-
Tharu: 6.2 percent
-
Tamang: 5.62 percent
-
Vishwakarma: 5.04 percent
The five caste and ethnic groups with the smallest populations are:
-
Nurang: 36 persons
-
Bankariya: 180 persons
-
Kusunda: 253 persons
-
Surel: 318 persons
-
Lhomi: 355 persons
Of the 125 caste and ethnic groups, only 76 have a population share of more than one percent of the total population.
Languages
According to the National Population Census 2078, 124 mother tongues have been identified in Nepal, compared to 123 in 2068 B.S.
By mother tongue, the five most widely spoken languages are:
-
Nepali: 44.86 percent
-
Maithili: 11.05 percent
-
Bhojpuri: 6.24 percent
-
Tharu: 5.88 percent
-
Tamang: 4.88 percent
Only 21 mother tongues have more than 100,000 speakers.
The five least spoken mother tongues are:
-
Kusunda: 23 speakers
-
Bankariya: 86 speakers
-
Sama: 106 speakers
-
Haryanvi: 114 speakers
-
Sadhri: 122 speakers
Religion
According to the National Population Census 2078, people in Nepal follow 10 different religions. The results show the following distribution:
-
Hindu: 81.19 percent
-
Buddhist: 8.21 percent
-
Islam: 5.09 percent
-
Kirat: 3.17 percent
-
Christian: 1.76 percent
According to the 2068 B.S. census results:
-
Hindu: 81.34 percent
-
Buddhist: 9.04 percent
-
Islam: 4.39 percent
-
Kirat: 3.05 percent
-
Christian: 1.42 percent
Life Expectancy
According to the National Population Census 2078, average life expectancy in Nepal is 71.4 years. By sex:
-
Men: 68.7 years
-
Women: 74.3 years
By province, the highest average life expectancy is in Bagmati Province at 72.8 years, and the lowest is in Lumbini Province at 69.7 years.
According to the 2068 B.S. census, average life expectancy in Nepal was 66.6 years. Similarly, according to the 2038 B.S. census, average life expectancy was 49.8 years, with:
-
Men: 50.9 years
-
Women: 48.1 years
Average life expectancy in Nepal has been gradually increasing.
Literacy
According to the National Population Census 2078, the literacy rate among people aged five years and above is 76.2 percent. By sex:
-
Men: 83.6 percent
-
Women: 69.4 percent
By province, the highest literacy rate is in Bagmati Province at 82.1 percent, and the lowest is in Madhesh Province at 63.5 percent. Male and female literacy rates are also lowest in Madhesh Province, with:
-
Male literacy: 72.5 percent
-
Female literacy: 54.7 percent
By district, the highest literacy rate is in Kathmandu at 89.23 percent, and the lowest is in Rautahat at 57.75 percent. The other four districts with the lowest literacy rates are Mahottari, Sarlahi, Humla and Bara.
Analysing literacy by electoral constituency shows that the three constituencies with the highest literacy rates are Kathmandu Constituency No. 1, Rupandehi Constituency No. 2 and Kathmandu Constituency No. 5, where the literacy rates are 92.9, 91.4 and 90.9 percent respectively.
Poverty and Inequality Levels
According to the latest poverty results published by the Central Bureau of Statistics, 20.27 percent of Nepal’s population lives below the poverty line, which is roughly 6 million people.
By area:
-
Urban areas: 18.34 percent of the population is below the poverty line
-
Rural areas: 24.66 percent of the population is below the poverty line
Looking at the distribution of the poor population:
-
Urban areas: 62.86 percent of the poor population
-
Rural areas: 37.14 percent of the poor population
By sex of household head:
-
Among households with a male household head, 20.27 percent are below the poverty line
-
Among households with a female household head, 20.28 percent are below the poverty line
Nepal’s inequality index for poverty is 4.42, and the depth of poverty is 1.48.
The Gini coefficient, used to measure inequality, is 0.30. A value of 0 indicates complete equality, and a value of 1 indicates complete inequality. The Gini coefficient is 0.30 in urban areas and 0.29 in rural areas. Compared to rural areas, there is greater inequality in consumption in urban areas.
The Sixteenth Plan has set a target of reducing the share of the population living below the poverty line to 12 percent by Fiscal Year (FY) 2085/86.
Poverty by Province and by Urban–Rural Area
By province, the highest poverty rate is in Sudurpashchim Province, where 34.16 percent of the population is below the poverty line. The lowest poverty rate is in Gandaki Province at 11.88 percent.
In the other provinces, the poverty rates are:
-
Koshi Province: 17.19 percent
-
Madhesh Province: 24.93 percent
-
Bagmati Province: 12.59 percent
-
Lumbini Province: 24.35 percent
-
Karnali Province: 26.69 percent
The largest number of people living in poverty is in Madhesh Province.
Analysing poverty by urban and rural areas within the provinces shows that:
-
The highest poverty rate is in the rural areas of Sudurpashchim Province at 40.21 percent
-
The lowest poverty rate is in the urban areas of the Kathmandu Valley at 7.38 percent
Labour Force, Employment and Unemployment
According to the Nepal Labour Force Survey 2014/75, among the working-age population aged 15 years and above:
-
Employment-to-population ratio: 34.2 percent
-
Labour force participation rate: 38.5 percent
-
Unemployment rate: 11.4 percent
According to the Nepal Living Standards Survey 2079/80, among the working-age population aged 15 years and above:
-
Employment-to-population ratio: 32.4 percent
-
Labour force participation rate: 37.1 percent
-
Unemployment rate: 12.6 percent
By province, the highest unemployment rate is in Karnali Province at 23.8 percent, and the lowest is in Madhesh Province at 4.4 percent.
The Sixteenth Plan has set a target of reducing the unemployment rate to 5 percent by FY 2085/86.
Gross Domestic Product and Provincial Contribution
In FY 2081/82, Nepal’s Gross Domestic Product (GDP) at consumer prices was estimated to be Rs. 61 kharba 7 arba 22 crore. At constant prices, the economic growth rate was estimated to be 3.9 percent at basic prices and 3.61 percent at consumer prices.
The estimated contributions of the major sectors to total GDP are:
-
Primary sector: 24.6 percent
-
Secondary sector: 12.4 percent
-
Services sector: 62.0 percent
The estimated provincial contributions to total GDP are:
-
Bagmati Province: 36.52 percent
-
Koshi Province: 15.90 percent
-
Lumbini Province: 14.23 percent
-
Madhesh Province: 13.16 percent
-
Gandaki Province: 8.98 percent
-
Sudurpashchim Province: 7.03 percent
-
Karnali Province: 4.19 percent
Per Capita Income
In FY 2081/82, per capita national income was 1,456 US dollars, compared to 1,467 US dollars in the previous fiscal year.
In the same year, per capita disposable income was 1,940 US dollars, compared to 1,864 US dollars in the previous fiscal year.
The Sixteenth Plan has set a target of increasing per capita national income to 2,351 US dollars by FY 2085/86.
Remittances and Household Use
According to the Fourth Nepal Living Standards Survey 2079/80, 55.8 percent of households across the country receive remittances. On average, such households receive Rs. 145,093.
Of the total remittances received by households:
-
29.3 percent comes from within Nepal
-
21.3 percent comes from India
-
49.4 percent comes from countries other than India
Households mainly spend remittances on daily consumption. The use of remittances is distributed as follows:
-
72.4 percent on daily consumption
-
18.8 percent on debt repayment
-
4.8 percent on education (within Nepal)
-
1.9 percent on the purchase of durable household goods
-
1.9 percent on savings
-
1.8 percent on capital formation
Agriculture and Farming Households
According to the National Agricultural Census 2078, there are about 4.131 million farming households in Nepal. By province, the largest number of farming households is in Koshi Province, and the smallest number is in Karnali Province.
In 2068 B.S., the number of farming households was about 3.831 million.
The total area of land used for agricultural activities is 2,218,000 hectares. Although the number of farming households is increasing, the area of land used for agricultural activities is decreasing.
Among farming households:
-
25 percent both consume and sell the agricultural products they produce
-
Only 45 percent have agricultural production sufficient to meet their food needs for the whole year
Human Development Index
According to the United Nations Development Programme’s global Human Development Report published in 2024, Nepal’s Human Development Index (HDI) is 0.602, placing Nepal 145th out of 193 countries.
Nepal’s HDI values in earlier years were:
-
2022: 0.605
-
2021: 0.596
-
2000: 0.411
The Sixteenth Plan has set a target of increasing the HDI to 0.650 by FY 2085/86.
Use of Statistics and Evidence-Based Policy
The statistics mentioned above are only some example figures from the economic and social sectors. The availability of such statistics becomes meaningful only when they are used to design evidence-based policies, plans and programmes aimed at achieving coordinated development across all sectors of society.
We should all help develop a culture of formulating policies, giving views and shaping perspectives based on facts.
Key Statistic
1. Geography and Federal Structure
| Category | Indicator | Value |
|---|---|---|
| Geographic regions | Main regions | Himalayan, Hill, Tarai (plains) |
| Federal structure | Provinces | 7 |
| Districts | 77 | |
| Electoral constituencies | 165 | |
| Local levels | 753 | |
| Local levels (breakdown) | Municipalities | 293 |
| Rural municipalities | 460 | |
| Wards | 6,743 |
2. Population Size and Distribution (Census 2078)
| Category | Indicator | Value |
|---|---|---|
| Total population | Population | 29,164,578 |
| Households | Number of households | 6,666,937 |
| Sex-wise population | Men | 14,253,551 (48.98%) |
| Women | 14,911,027 (51.02%) | |
| Other gender | Population | 2,928 |
| Sex ratio | Males per 100 females | 95.59 |
| Population density | Persons per sq. km | 198 |
| Household size | Average household size | 4.37 members |
3. Population by Province (Share of Total Population, 2078)
| Province | Share of Total Population (%) |
|---|---|
| Bagmati | 20.97 |
| Madhesh | 20.97 |
| Lumbini | 17.56 |
| Koshi | 17.01 |
| Sudurpashchim | 9.24 |
| Gandaki | 8.46 |
| Karnali | 5.79 |
Additional note: Bagmati has 2,266 more people than Madhesh and is treated as having the largest population.
4. Population by Type of Local Level (2078)
| Category | Indicator | Value (%) |
|---|---|---|
| Settlement type | Municipal areas | 66.17 |
| Rural municipalities | 33.83 |
5. Historical Population and Growth
| Category | Indicator | Value |
|---|---|---|
| First census | Year (B.S.) | 1968 |
| Census centenary | Year (B.S.) | 2068 |
| Latest census | Census number and year | 12th census, 2078 B.S. |
| Population, first census | Population | 5,638,749 |
| Population, 12th census | Population | 29,164,578 |
| Increase since 1968 B.S. | Approximate increase | About 23.5 million |
| Population growth 2068–2078 | Decadal increase | 10.1% |
6. Geographic Distribution: Tarai, Hill, Himalayan
a) Regional Distribution (2078 – main breakdown in text)
| Region | Share of Population (%) |
|---|---|
| Tarai | 53.6 |
| Hill | 40.31 |
| Himalayan | 6.08 |
b) Comparison with 2068 (Tarai, Hill, Himalayan)
| Region | Share in 2068 (%) | Share in 2078 (%) (as stated) |
|---|---|---|
| Tarai | 50.3 | 46.7 |
| Hill | 43.0 | – |
| Himalayan | 6.7 | – |
7. Population Growth Rates and District Pattern
| Period (B.S.) | Indicator | Value (%) |
|---|---|---|
| 2048–2058 | Annual average population growth rate | 2.25 |
| 2058–2068 | Annual average population growth rate | 1.35 |
| 2068–2078 | Annual average population growth rate | 0.92 |
| Category | Indicator | Value |
|---|---|---|
| District growth pattern (2078 vs 2068) | Districts with negative growth (Himalayan+Hill) | 34 |
| 2068 census comparison | Districts with negative growth (Himalayan+Hill) | 27 |
| Highest district growth rate | Bhaktapur | 3.35% |
| Most negative district growth rate | Ramechhap | -1.67% |
8. Age Structure and Demographic Dividend (2078)
| Age Group | Indicator | Share of Population (%) |
|---|---|---|
| Working age | 15–59 years | 61.96 |
| Children | 0–14 years | 33.84 |
| Adolescents | 16–24 years | 17.63 |
| Youth | 16–40 years | 42.56 |
| Senior citizens | 60 years or above | 10.21 |
| Older population | 65 years or above (as stated in source) | 60.9 |
| Census Year (B.S.) | Working-Age Share (15–59 years, %) |
|---|---|
| 2058 | 54 |
| 2068 | 57 |
| 2078 | 61.96 |
9. Dependency Ratio and Female-Headed Households
| Census Year (B.S.) | Indicator | Value |
|---|---|---|
| 2048 | Dependency ratio | 67.2 |
| 2078 | Dependency ratio | 53.3 |
Definition: Number of children (0–14 years) and elderly (65+ years) per 100 people in the 15–64 age group.
| Census Year (B.S.) | Indicator | Value (%) |
|---|---|---|
| 2058 | Households with female head | 14.87 |
| 2068 | Households with female head | 25.73 |
| 2078 | Households with female head | 31.55 |
| Province | Female-Headed Households (%) |
|---|---|
| Gandaki | 41.0 (highest) |
| Madhesh | 21.7 (lowest) |
10. Caste and Ethnic Composition
| Category | Indicator | Value |
|---|---|---|
| Number of caste/ethnic groups (2068) | Groups | 125 |
| Number of caste/ethnic groups (2078) | Groups | 142 |
| Newly added groups | Number | 17 |
| Groups with >1% of total population | Number (out of 125) | 76 |
Major Caste/Ethnic Groups (by share, 2078)
| Group | Share of Population (%) |
|---|---|
| Chhetri | 16.45 |
| Hill Brahmin | 11.29 |
| Magar | 6.9 |
| Tharu | 6.2 |
| Tamang | 5.62 |
| Vishwakarma | 5.04 |
Smallest Caste/Ethnic Groups (by number, 2078)
| Group | Population (Persons) |
|---|---|
| Nurang | 36 |
| Bankariya | 180 |
| Kusunda | 253 |
| Surel | 318 |
| Lhomi | 355 |
11. Languages
| Category | Indicator | Value |
|---|---|---|
| Mother tongues identified (2068) | Number of languages | 123 |
| Mother tongues identified (2078) | Number of languages | 124 |
| Mother tongues with >100,000 speakers | Number of languages | 21 |
Five Most Widely Spoken Mother Tongues (2078)
| Language | Share of Population (%) |
|---|---|
| Nepali | 44.86 |
| Maithili | 11.05 |
| Bhojpuri | 6.24 |
| Tharu | 5.88 |
| Tamang | 4.88 |
Five Least Spoken Mother Tongues (2078)
| Language | Speakers (Persons) |
|---|---|
| Kusunda | 23 |
| Bankariya | 86 |
| Sama | 106 |
| Haryanvi | 114 |
| Sadhri | 122 |
12. Religion (Comparison 2068 vs 2078)
Distribution by Religion (2078)
| Religion | Share of Population (%) |
|---|---|
| Hindu | 81.19 |
| Buddhist | 8.21 |
| Islam | 5.09 |
| Kirat | 3.17 |
| Christian | 1.76 |
People in Nepal follow 10 religions in total (2078 census).
Distribution by Religion (2068)
| Religion | Share of Population (%) |
|---|---|
| Hindu | 81.34 |
| Buddhist | 9.04 |
| Islam | 4.39 |
| Kirat | 3.05 |
| Christian | 1.42 |
13. Life Expectancy
Overall and by Sex
| Census Year (B.S.) | Indicator | Value (Years) |
|---|---|---|
| 2038 | Average life expectancy | 49.8 |
| Men | 50.9 | |
| Women | 48.1 | |
| 2068 | Average life expectancy | 66.6 |
| 2078 | Average life expectancy | 71.4 |
| Men | 68.7 | |
| Women | 74.3 |
By Province (2078)
| Province | Average Life Expectancy (Years) |
|---|---|
| Bagmati | 72.8 (highest) |
| Lumbini | 69.7 (lowest) |