



A headline says a treatment reduces risk by 20%. Another reports that an exposure doubles the risk of a particular condition. Both statements describe relative changes, but neither tells you the actual probability of the event occurring.
Understanding absolute vs relative risk helps explain what these percentages mean and whether the reported change is substantial.
Absolute risk describes the probability of an event occurring in a defined group over a specified period. Relative risk compares that probability between two groups. The absolute risk difference shows how much the probability changes.
These measures answer different questions. A large relative reduction can correspond to a small difference in actual event probabilities. A modest relative change can also matter when the starting risk is high.
The distinction is particularly relevant when interpreting health news, medical research, clinical trial results, and public-health information. It helps readers recognize incomplete claims without assuming that relative statistics are inherently misleading.
Answer Summary: Absolute risk tells you how likely an event is to occur. Relative risk tells you how that probability compares between groups. Absolute risk reduction measures the difference between two event probabilities, while relative risk reduction expresses that difference as a proportion of the starting risk. To interpret a claim accurately, identify the original probability, comparison group, outcome, observation period, and uncertainty. Both absolute and relative measures provide useful information, but neither tells the whole story independently.
What Are Absolute Risk and Relative Risk?
Absolute risk and relative risk are related statistical measures, but they describe different aspects of probability.
Absolute risk: The probability of an event
Absolute risk is the probability that a specified event will occur within a defined population during a stated period.
For a basic group comparison with complete follow-up, it can be calculated by dividing the number of people who experience the event by the number of people initially at risk.
For example, if five people out of 100 experience an outcome during a specified period, the observed absolute risk is 5%.
This means:
-
Five out of 100 experienced the event.
-
Ninety-five out of 100 did not experience it.
-
The probability refers to the population and observation period being studied.
The timeframe matters. A probability measured over one year cannot automatically be compared with a lifetime probability.
Absolute risk is also different from an absolute risk difference. The first describes one probability; the second compares two probabilities.
Relative risk: Comparing two probabilities
Relative risk, also called the risk ratio (RR), compares the probability of the same event between two groups.
The National Cancer Institute defines relative risk as a measure comparing the likelihood of an event in one group with its likelihood in another.
A relative risk of:
-
1 means the estimated probabilities are equal.
-
Greater than 1 means the event is more likely in the numerator group.
-
Less than 1 means the event is less likely in the numerator group.
For instance, a risk ratio of 2 indicates that the event probability is twice that of the reference group.
It does not establish whether the original probability was 1%, 10%, or another value.
Similarly, a risk ratio of 0.80 means the probability in the group being evaluated is 80% of the reference-group probability.
The direction of the comparison depends on which group appears in the numerator.
Why the Same Relative Risk Reduction Can Mean Different Things
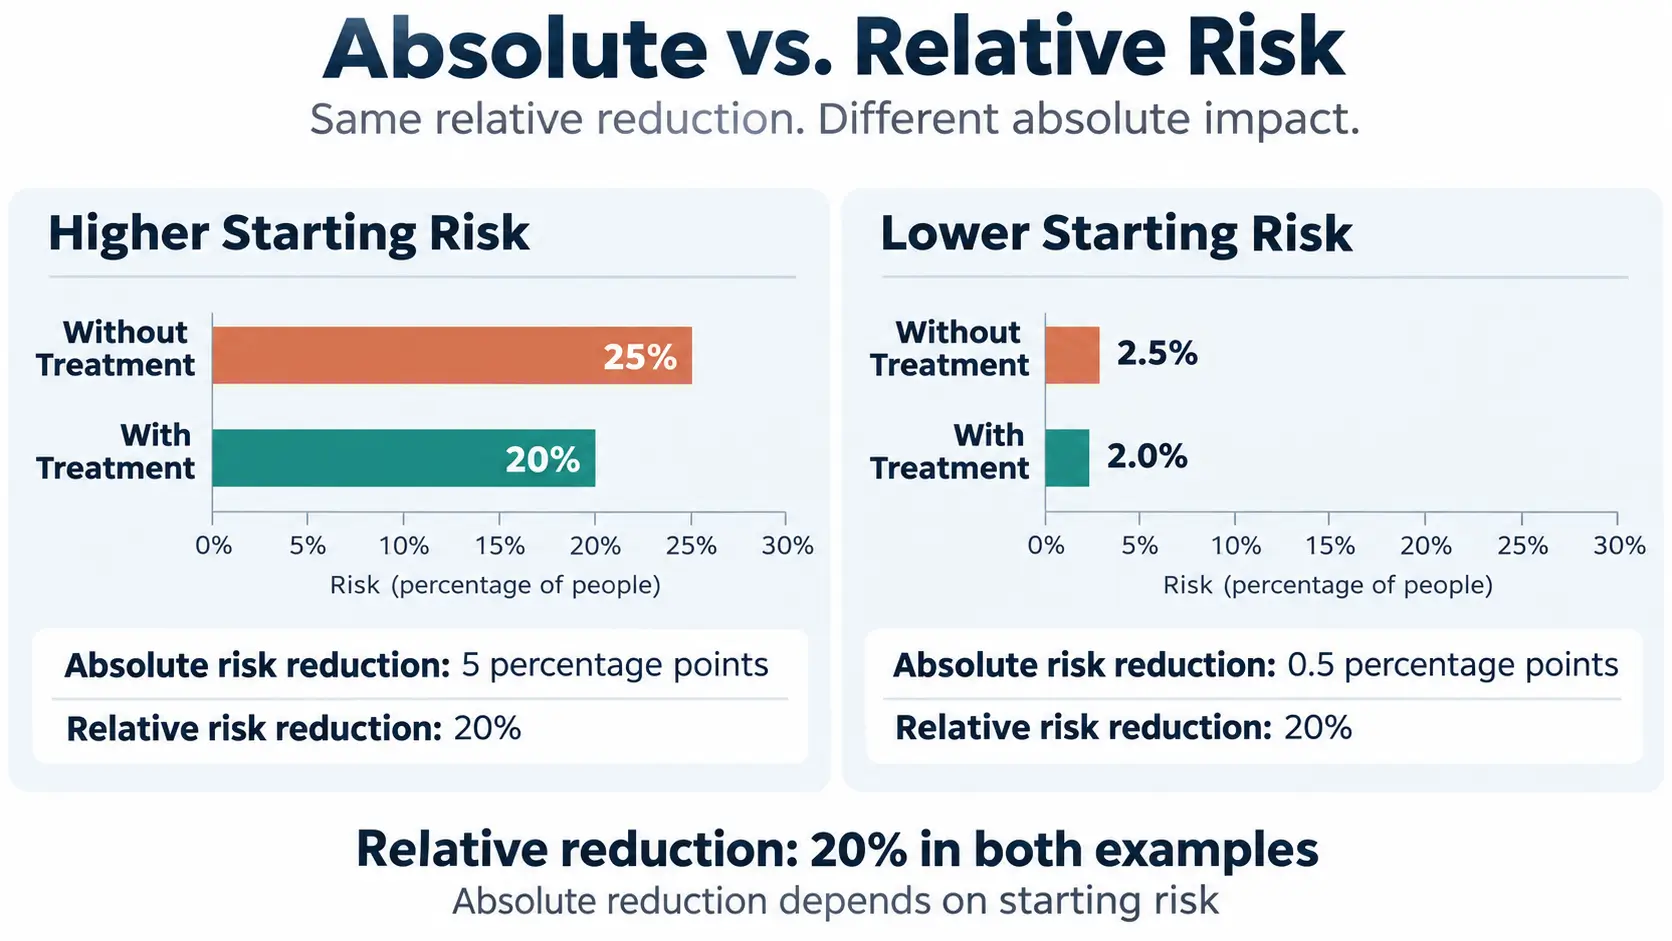
A relative risk reduction can remain identical even when the absolute number of affected people differs substantially.
The following two illustrations are presented by BMJ Best Practice in its explanation of risk statistics. They demonstrate the effect of different starting probabilities rather than reporting results from two separate clinical trials.
|
Measure |
Higher starting risk |
Lower starting risk |
|---|---|---|
|
Risk without treatment |
25% |
2.5% |
|
Risk with treatment |
20% |
2.0% |
|
Absolute risk reduction |
5 percentage points |
0.5 percentage points |
|
Relative risk reduction |
20% |
20% |
|
Equivalent absolute difference |
5 fewer events per 100 people |
5 fewer events per 1,000 people |
In the first illustration, the probability decreases from 25% to 20%.
That represents an absolute reduction of five percentage points, equivalent to five fewer events per 100 people.
In the second illustration, the probability decreases from 2.5% to 2.0%.
That represents an absolute reduction of half a percentage point, equivalent to five fewer events per 1,000 people.
Yet the relative reduction is 20% in both cases.
The first absolute reduction is ten times larger than the second.
These examples demonstrate why a relative percentage cannot establish the magnitude of an absolute change without the starting probability.
They do not establish that a particular treatment produces identical relative effects in different populations. Whether a relative effect applies across populations depends on the available evidence.
How to Calculate Absolute and Relative Risk
The calculations become easier when the starting and comparison probabilities are clearly identified.
The formulas below apply to simple comparisons of an event that either occurs or does not occur over a comparable observation period.
Step 1: Identify the two probabilities
In a treatment comparison, the starting probability is commonly called the control risk.
The probability in the treatment group is called the treatment risk.
Using BMJ's higher-risk illustration:
Control risk = 25% = 0.25
Treatment risk = 20% = 0.20
Both figures refer to the same outcome under the illustrative comparison.
Step 2: Calculate absolute risk reduction
Absolute risk reduction (ARR) is the difference between the control risk and the lower treatment risk.
Using the example:
The absolute risk reduction is five percentage points.
This describes the difference in event probability between the groups.
If the treatment-group probability were higher, the difference in the opposite direction would be called an absolute risk increase (ARI).
Step 3: Calculate relative risk
Relative risk divides the probability in the group being evaluated by the reference-group probability.
Using the same figures:
The risk ratio is 0.80.
The estimated event probability in the treatment group is therefore 80% of the probability in the control group.
Step 4: Calculate relative risk reduction
Relative risk reduction (RRR) expresses the proportional decrease relative to the starting probability.
The relative risk reduction is 20%.
This does not mean that 20 additional people out of every 100 avoid the event.
It means the probability is 20% lower relative to the original 25% probability.
The same calculation can be written as:
The calculations describe different aspects of the same comparison:
-
Absolute risk reduction: 5 percentage points.
-
Relative risk: 0.80.
-
Relative risk reduction: 20%.
None of these values is interchangeable with another.
What Does It Mean When a Headline Says Risk Doubles?
A doubled risk means the comparison probability is twice the reference probability. It does not mean the event is certain or even common.
The US Centers for Disease Control and Prevention (CDC) uses an educational example in which an event probability increases from one out of 100 to two out of 100.
The relative risk is:
The relative increase is:
But the absolute increase is:
Both descriptions are correct.
The event probability has doubled, yet the absolute difference is one additional event per 100 people.
The CDC uses this distinction to explain why relative-only statements can give an incomplete impression of risk.
The example is illustrative, not evidence about a specific exposure.
When a headline says an event becomes 50% more likely, the same principle applies. The relative increase describes a proportional change, but the actual increase remains unknown until the starting probability is established.
Why Baseline Risk Matters
Baseline risk is the probability of an event in the reference group.
It determines how a relative change translates into an absolute difference.
The BMJ illustrations demonstrate this directly. Applying a 20% relative reduction to a baseline of 25% produces a different absolute change from applying it to a baseline of 2.5%.
This distinction has two important implications.
First, a large relative effect does not necessarily correspond to a large absolute difference.
Second, a small absolute difference is not automatically unimportant.
The relevance of a change depends on the seriousness of the outcome, the population affected, possible harms, and the practical consequences.
A relatively uncommon but serious outcome may matter greatly to an individual. A small difference affecting a large population may also have substantial public-health implications.
Baseline risks can differ between populations because of their characteristics and circumstances.
A relative effect estimated in one population should not automatically be applied to another without evidence that the comparison is appropriate.
The CONSORT 2025 reporting guideline identifies baseline risk as a reason absolute risk differences may vary across populations even when relative effects are similar.
How to Read a Risk Claim Accurately
A risk percentage becomes more meaningful when readers identify five pieces of information.
1. What event is being measured?
Determine the precise outcome.
A research study may examine diagnosis, hospital admission, a laboratory finding, death, or a combination of outcomes.
These measurements have different meanings.
An apparent improvement in one outcome does not automatically establish an improvement in another.
2. Which groups are being compared?
Identify the reference group and the group being evaluated.
The comparison may involve:
-
Treatment versus no treatment.
-
One intervention versus another.
-
Exposure versus no exposure.
The reference group determines how the relative percentage is interpreted.
3. What are the starting and comparison probabilities?
Find the original event probability and the probability in the comparison group.
A statement that risk decreases by 30% is incomplete when the baseline risk is missing.
Look for the number of people experiencing the outcome and the number included in each group.
Where possible, express both probabilities using the same denominator, such as events per 100 or per 1,000 people.
The US Agency for Healthcare Research and Quality (AHRQ) recommends consistent denominators and observation periods when explaining risks.
4. Over what period was the event measured?
Check the observation period.
A five-year probability is not equivalent to a one-year probability.
Different observation periods can also affect the usefulness of an absolute risk comparison.
When the original study does not provide a relevant timeframe, avoid supplying one from assumption.
5. How reliable and applicable is the estimate?
Examine the study design, population, uncertainty, and outcome measurement.
An accurately calculated percentage can still come from weak evidence or an analysis that does not support a causal interpretation.
For broader guidance, readers can evaluate research claims by examining study methods, evidence quality, limitations, and conclusions.
The five questions help distinguish what a statistic shows from what remains uncertain.
Why Study Quality Matters Beyond the Percentage
Understanding the calculation is necessary, but it does not establish that a reported effect is reliable or applicable to a particular situation.
Confidence intervals show uncertainty
Research findings are estimates rather than exact descriptions of an underlying population effect.
A confidence interval provides a range of values compatible with the observed data under the statistical method and its assumptions.
A wide interval generally indicates greater uncertainty about the estimated effect than a narrow interval.
For a risk ratio, 1 represents equal estimated event probabilities.
For a risk difference, 0 represents no estimated difference.
Whether a confidence interval includes these values helps assess statistical evidence, but it should not be treated as the sole test of importance.
A result may be statistically significant while producing a small absolute difference. Another result may remain uncertain while still being compatible with an important effect.
CONSORT 2025 recommends reporting effect estimates with confidence intervals and presenting both absolute and relative measures for binary outcomes.
Association is not necessarily causation
Relative risk is used in experimental and observational research.
Randomized controlled trials assign participants to comparison groups through randomization. When conducted and analyzed appropriately, this design supports stronger causal inference about interventions.
Observational studies examine associations without assigning exposures through randomization.
Their findings can be affected by confounding, selection bias, measurement limitations, and other factors.
A reported association between an exposure and an outcome does not, by itself, establish that the exposure caused the outcome.
The statistical tutorial by Monaghan and colleagues explains how measures of association must be interpreted alongside the research design and underlying data.
Benefits and harms need comparable presentation
A treatment or intervention may influence several outcomes.
A report that describes benefits through relative reductions but presents harms only as absolute percentages makes direct comparison difficult.
Readers should look for baseline and comparison probabilities for each important benefit and harm over compatible periods.
The purpose is not to assume deliberate deception. It is to ensure the numerical presentation is sufficiently complete for a balanced interpretation.
Why Absolute Risk Presentation Helps Readers Understand Evidence
Research on risk communication supports including absolute probabilities alongside relative measures.
A 2014 systematic review by Zipkin and colleagues examined 84 articles representing 91 studies of numerical and visual risk communication.
The review found that presentations including absolute risk reductions generally supported more accurate understanding than presentations emphasizing relative risk reductions.
Visual aids, including icon arrays and bar graphs, also improved understanding and satisfaction in the studies reviewed.
However, the findings varied across study designs and communication settings. The review did not establish one presentation format as universally superior.
AHRQ recommends presenting frequencies or percentages using comparable denominators and timeframes. It also cautions against routinely relying on number-needed-to-treat or complicated one-in-X formats when communicating with patients.
Clear reporting should allow readers to see both the relative comparison and the actual event probabilities.
Common Mistakes When Interpreting Risk Statistics
Several statistical distinctions can change the meaning of a reported risk claim.
Confusing percentages with percentage points
A reduction from 25% to 20% is five percentage points.
The relative reduction is 20%.
These statements describe the same comparison using different measures.
Saying the event probability decreased by five percent would be ambiguous and potentially misleading.
Treating odds ratios and hazard ratios as risk ratios
Odds ratios, hazard ratios, and risk ratios are related but distinct statistical measures.
An odds ratio compares the odds of an event between groups.
A hazard ratio compares event hazards over time and is commonly used in time-to-event analysis.
A risk ratio compares event probabilities over a defined period.
The measures cannot automatically be substituted for one another.
The differences become especially important when translating statistical results into statements about actual event probabilities.
Confusing incidence rates with probabilities
An incidence rate expressed per person-year uses accumulated time at risk as its denominator.
An absolute risk describes the probability of an event occurring during a specified period.
These quantities are not identical.
Converting between them requires information about follow-up and assumptions concerning how events occur over time.
Misunderstanding number needed to treat
Number needed to treat (NNT) is a measure derived from absolute risk reduction.
For a beneficial reduction in an adverse outcome:
The absolute risk reduction must be expressed as a decimal.
In BMJ's higher-risk illustration:
In its lower-risk illustration:
The measure represents an average number of people who would need treatment for one additional person to benefit under the specified comparison conditions and observation period.
It does not predict which individual will benefit.
NNT is sensitive to baseline risk and timeframe. It also does not independently describe treatment harms or the seriousness of the outcome.
For public-facing communication, presenting the underlying event probabilities often gives readers a clearer picture than relying on NNT alone.
What to Do When a Risk Claim Is Missing Important Numbers
When a headline gives only a relative change, the original research may contain the absolute probabilities needed for interpretation.
Start by locating the original study or an authoritative research summary.
Then examine the results section, outcome tables, and supplementary material.
Look for:
-
The number of participants experiencing the event.
-
The total number assessed in each group.
-
The observation period.
-
The reported relative effect and confidence interval.
-
Any important qualifications concerning the population or analysis.
Readers who are unfamiliar with academic articles can read the original research paper to locate the methods, results, tables, and limitations.
If both comparable event probabilities are available, a simple absolute difference can be calculated.
However, adjusted statistical estimates require additional care.
A reported relative effect may come from a model that accounts for participant characteristics or other variables. Combining that adjusted estimate with an unrelated baseline probability may not reproduce the study's adjusted absolute effect.
If no appropriate baseline is available, the absolute difference cannot be determined reliably from the relative percentage alone.
For personal healthcare decisions, a qualified clinician can help interpret relevant probabilities, possible benefits, harms, and alternatives. Evidence-based patient decision aids may also support such discussions. Cochrane describes these tools as supplements to professional consultation rather than replacements for it.
Conclusion
Relative risk explains how probabilities compare between groups. Absolute risk shows how likely an event is to occur. Absolute risk difference reveals how much that probability changes.
An accurate interpretation requires more than checking whether a percentage appears large or small.
The outcome, baseline probability, comparison group, observation period, study quality, and uncertainty determine what the reported figure can reasonably support.
When these details are available, readers can understand risk claims without exaggerating their significance or dismissing potentially important findings.
References
1. BMJ Best Practice. Understanding Statistics: Risk. Definitions and calculations for absolute risk, relative risk, absolute risk reduction, relative risk reduction, and number needed to treat.
2. National Cancer Institute. Definition of Relative Risk. NCI Dictionary of Cancer Terms.
3. Centers for Disease Control and Prevention. (2026). Understanding and Applying Risk Communication Principles.
4. Agency for Healthcare Research and Quality. The SHARE Approach: Communicating Numbers to Your Patients.
5. Zipkin, D. A., et al. (2014). Evidence-Based Risk Communication: A Systematic Review. Annals of Internal Medicine, 161(4), 270–280.
6. Hopewell, S., et al. (2025). CONSORT 2025 Explanation and Elaboration: Updated Guideline for Reporting Randomised Trials. BMJ, 389, e081124.
7. Monaghan, T. F., et al. (2021). Foundational Statistical Principles in Medical Research: A Tutorial on Odds Ratios, Relative Risk, Absolute Risk, and Number Needed to Treat. International Journal of Environmental Research and Public Health, 18(11), 5669.
8. Cochrane. Patient Decision Aids to Help People Facing Treatment or Screening Decisions. Evidence review summary.
This article explains statistical concepts for educational purposes. It does not provide individualized medical advice or establish the benefits, risks, or effectiveness of any particular treatment.




Comments 0
No comments yet. Be the first to start the conversation.