



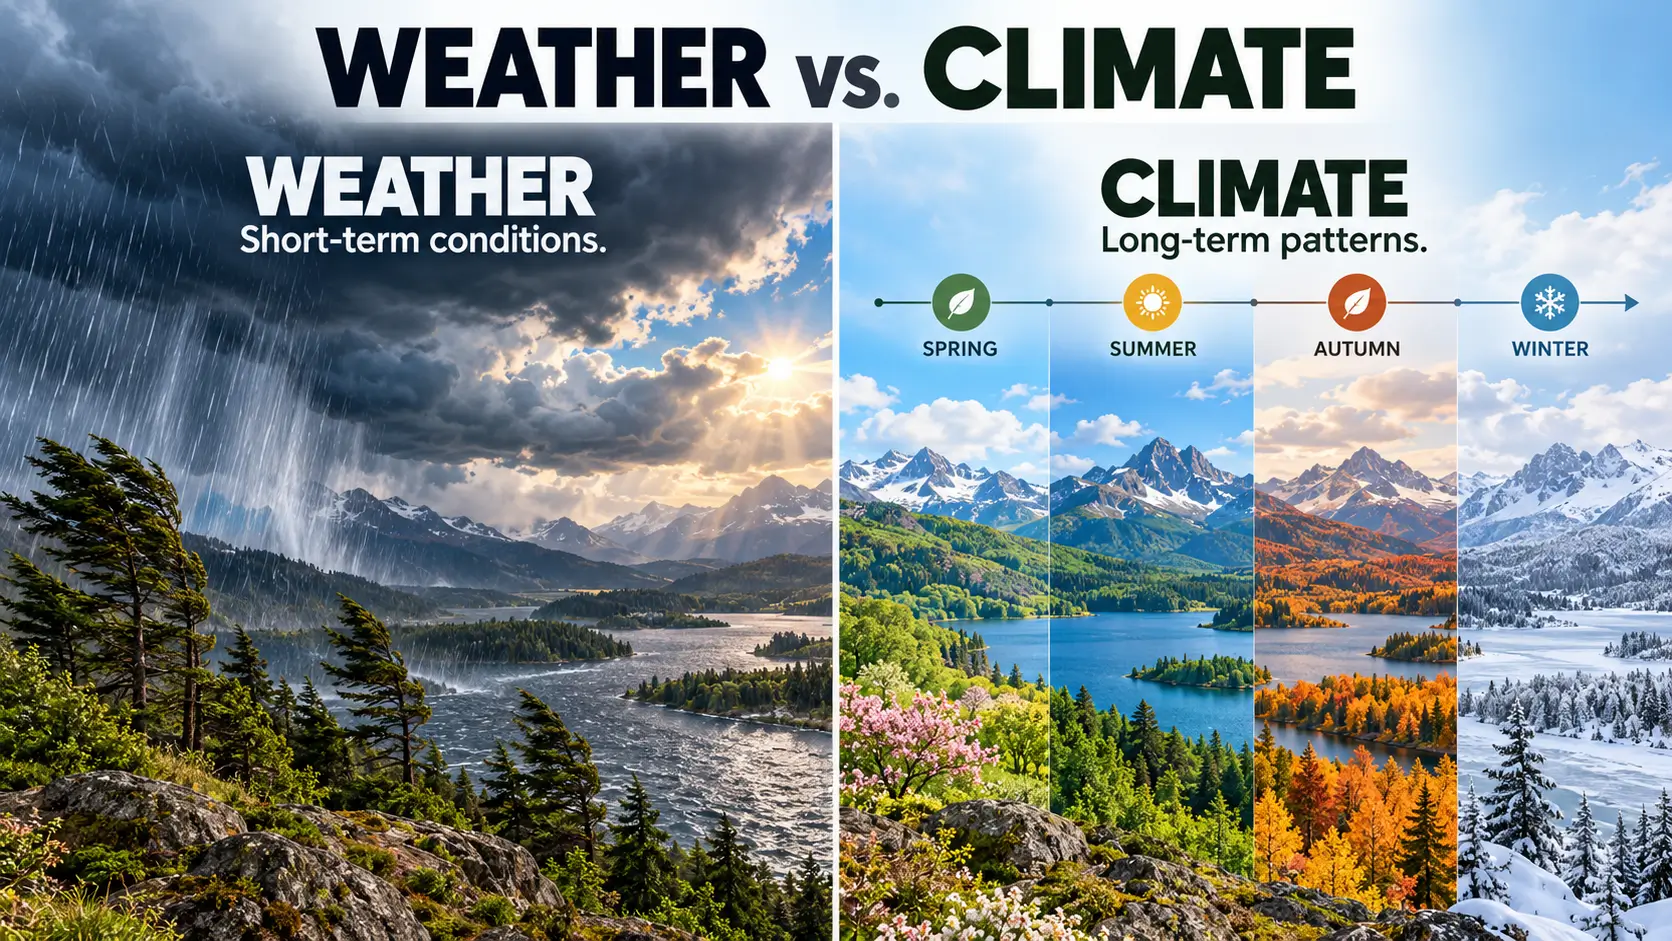
Weather describes atmospheric conditions at a particular time and place, such as today's temperature, rainfall or wind. Climate describes the longer-term patterns of those conditions, including what is typical, how much conditions vary and how frequently extremes occur.
Both concern the same atmosphere, but they answer different questions.
The distinction matters when interpreting weather forecasts, understanding seasonal conditions or evaluating claims about climate change. A cold week does not establish that the planet is cooling, and one unusually hot day does not, by itself, demonstrate a long-term warming trend.
Understanding climate versus weather requires more than distinguishing short-term from long-term conditions. It also means knowing how weather observations become climate information, what a 30-year average represents and which evidence is appropriate for a particular question.
What Is the Difference Between Weather and Climate?
The main difference between weather and climate is the period over which atmospheric conditions are described and analyzed.
Weather concerns conditions at a specific time and location. Climate concerns the characteristics of those conditions across longer periods, including their averages, seasonal patterns, variability and extremes.
The UK Met Office explains that climate includes not only average conditions but also extreme values and the frequency of different weather conditions.
|
Comparison |
Weather |
Climate |
|---|---|---|
|
Main question |
What is happening in the atmosphere at a particular time and place? |
What conditions are characteristic of a place over a longer period? |
|
Time perspective |
Minutes, hours, days and other observed periods |
Years to decades or longer |
|
Geographic scale |
A particular location or forecast area |
A location, region or the planet |
|
Measurements |
Temperature, rainfall, humidity, wind, pressure and clouds |
Averages, seasonal patterns, variability, frequencies and extremes |
|
Typical information |
Current observations, forecasts and warnings |
Historical records, climate normals, trends and projections |
|
Example |
Heavy rain occurring this afternoon |
The usual seasonal rainfall pattern of a region |
|
Practical use |
Planning immediate activities and responding to weather hazards |
Understanding typical conditions and assessing longer-term risks |
The distinction is not that weather and climate involve different measurements. Scientists may use the same temperature or rainfall observations for both.
What changes is the question being asked and the way those observations are analyzed.
What Is Weather?
Weather is the state of the atmosphere at a particular location and time.
It includes measurable conditions such as air temperature, precipitation, wind speed, wind direction, atmospheric pressure, humidity and cloud cover.
Weather can change within minutes or hours. A morning may begin with clouds and rain, followed by sunshine later in the day. Conditions can also differ between nearby locations.
For example, a report that a town experienced heavy rainfall yesterday describes weather. The statement identifies a place, a period and an observed atmospheric condition.
Weather information may describe what has happened, what is happening or what is expected.
Meteorologists use atmospheric observations and forecasting methods to estimate future conditions. These forecasts help people plan travel, outdoor activities and responses to hazardous weather.
Weather observations can also be summarized over longer intervals. Monthly rainfall totals and annual maximum temperatures remain summaries of observed weather. Their duration alone does not establish a changing climate.
What Is Climate?
Climate is the characteristic pattern and statistical distribution of weather conditions over an extended period.
It describes more than average temperature or rainfall. Climate also includes how conditions differ across seasons, how much they vary between years and how often particular extremes occur.
For example, describing a region's climate may involve examining:
-
Typical temperatures during different months or seasons.
-
The timing and amount of seasonal rainfall.
-
Differences between wetter and drier years.
-
The frequency of unusually hot or cold conditions.
-
The occurrence and intensity of certain extreme weather events.
Two locations may have similar annual average temperatures but substantially different rainfall patterns or seasonal variations.
This illustrates why one average cannot fully describe a climate.
Climate may refer to a small geographic area, a broader region or Earth as a whole. The geographic scale matters because local climate characteristics are not identical to global climate patterns.
Why Is Climate Commonly Measured Over 30 Years?
Scientists commonly use 30-year periods to calculate climatological standard normals because these provide a consistent reference for comparing weather conditions across years and locations.
The World Meteorological Organization (WMO) defines climatological standard normals using consecutive 30-year reference periods, including 1981–2010 and 1991–2020.
These reference periods help distinguish typical conditions from short-term departures and support comparisons using a defined historical benchmark.
What Is a Climate Normal?
A climate normal is a statistical reference derived from weather observations collected over a specified historical period.
For example, a climate normal for average daily maximum temperature in June can be calculated using observations from many Junes within a 30-year period.
The resulting figure provides a benchmark for interpreting temperatures observed during a particular June.
NOAA's 1991–2020 U.S. Climate Normals, released in May 2021, provide such reference information for the United States.
These products are not created by indiscriminately averaging every available measurement. NOAA describes procedures that address issues such as missing observations and changes in weather stations or instruments.
Such adjustments help produce more consistent statistical records.
The 30-year convention does not mean scientists must wait exactly 30 years before identifying a climate-related pattern.
Researchers can examine shorter periods when studying recent changes, provided the available evidence supports their conclusions and the limitations are clear.
Climate can also be described for a particular month or season. A climate statistic for January, for instance, may summarize observations from many Januaries rather than observations from one month.
Why Does the Reference Period Matter?
A climate normal depends on the years used to calculate it.
For example, a temperature anomaly calculated against 1991–2020 may differ from an anomaly calculated against an earlier historical period.
An anomaly is the difference between an observed value and a specified reference value.
If a weather report describes conditions as warmer than normal, the comparison should identify the location, measurement and reference period.
Without that information, the statement may be difficult to interpret accurately.
There is also an important distinction between a recent climate normal and a fixed historical baseline.
Recent normals are useful for comparing present conditions with relatively recent weather patterns. A fixed historical baseline can be useful when examining long-term climate changes because it provides a consistent reference for comparison.
The WMO retains 1961–1990 as a reference period for certain long-term climate-change assessments, while also defining more recent climatological standard normals.
These approaches serve different analytical purposes.
Does Normal Mean the Weather Expected Every Day?
No. A climate normal is a benchmark, not a prediction of the conditions that will occur on a particular day.
A location's actual temperature can be higher or lower than its historical average.
Similarly, an average monthly rainfall total does not indicate that rain will fall evenly throughout the month.
A month may contain several dry days and a smaller number of days with substantial rainfall.
Averages summarize observations but do not preserve every feature of the original records.
This is why climate information should include variability and, where relevant, the frequency and intensity of extreme conditions.
Someone assessing seasonal rainfall risk may need to know not only the average total but also how often unusually wet or dry seasons have occurred.
An average alone cannot answer that question.
How Are Weather and Climate Connected?
Weather and climate are closely connected because long-term weather observations provide much of the information used to describe climate.
Weather stations and other observing systems collect information about temperature, precipitation, wind and other atmospheric conditions.
Over time, these observations contribute to records that scientists use to study average conditions, seasonal changes, unusual events and longer-term trends.
Climate analysis also examines the wider climate system, including interactions involving the atmosphere, oceans, land and ice.
Weather and climate are different ways of understanding related physical processes rather than separate phenomena.
Why Climate Is More Than an Average
Consider what happens when temperature observations are summarized over several decades.
An average can describe the central tendency of the recorded temperatures, but it cannot fully explain how widely they vary.
To describe the climate more meaningfully, researchers may also examine differences between seasons and years, the range of recorded temperatures and the frequency of unusually hot or cold conditions.
These measures answer different questions.
A long-term average may help describe the general temperature of a place. The frequency of unusually hot days may be more relevant when assessing exposure to heat.
Likewise, knowing average seasonal rainfall is useful, but it does not establish how often intense rainfall events occur.
The distinction matters when comparing locations with similar averages but different patterns of variability.
A Real Example: The Pacific Northwest Heat Event of 2021
The Pacific Northwest heat event of June 2021 provides a documented example of how weather observations and climate records can be compared.
NOAA's Climate.gov educational resource presents daily maximum temperatures during June 23–27, 2021, alongside the region's average June maximum temperatures for the 1991–2020 reference period.
The two sets of information serve different purposes.
The daily maximum temperatures describe conditions experienced during the particular heat event.
The 1991–2020 June averages provide historical climate context for interpreting those conditions.
By comparing the same temperature measure across these different periods, readers can understand how unusual the event was relative to the historical reference.
The comparison does not independently establish a long-term temperature trend or quantify the contribution of human-caused climate change to that particular event.
Those questions require additional observations and analysis.
This example demonstrates an important principle: weather events can be placed in climate context without treating an individual event as sufficient evidence of a sustained climatic change.
Why Does the Difference Matter in Everyday Decisions?
The difference matters because weather forecasts, historical climate information and long-term climate projections support different kinds of decisions.
Using the wrong information can lead to misleading expectations.
A climate average cannot identify the exact weather tomorrow. A forecast for tomorrow cannot describe the usual conditions of an entire season.
The appropriate information depends on the decision and the period involved.
Short-Term Planning Requires Weather Information
Weather forecasts are useful when a decision depends on conditions over the coming hours or days.
A traveler deciding whether to change plans because of possible heavy rain needs a location-specific forecast and relevant weather warnings.
A farmer assessing whether conditions are suitable for harvesting over the next few days also needs short-term weather information.
Historical climate averages cannot replace these forecasts.
Even if a location generally experiences limited rainfall during a particular season, rain may still occur on a specific day.
For hazardous conditions, forecasts and warnings from the relevant national or local meteorological or emergency authority take priority over generalized climate descriptions.
Seasonal Planning Requires Climate Context
Climate information becomes useful when the question concerns conditions typically experienced during a season.
For example, someone preparing to visit another country several months ahead may want to understand the destination's usual temperatures and rainfall patterns.
Historical climate records can help establish those expectations.
However, the information should be interpreted carefully.
An average temperature does not describe the full range of possible conditions. Similarly, monthly rainfall totals may conceal substantial differences in the frequency and intensity of rainfall.
Seasonal planning may benefit from examining averages, variability and historical extremes together.
As the intended date approaches, updated weather forecasts become more relevant for immediate decisions.
Long-Term Planning Requires Climate Records and Projections
Some decisions concern conditions over decades rather than days or months.
These may include planning water resources, evaluating agricultural risks or assessing the climate conditions that infrastructure may face over its expected lifetime.
Historical climate records describe observed conditions and changes.
Climate projections provide information about possible future climate patterns and extremes under specified assumptions.
The UK Met Office distinguishes weather forecasts from climate projections by their purpose and time horizon. Forecasts estimate conditions over the coming days, while projections examine plausible future climate conditions over decades or longer.
A climate projection is not an attempt to predict the exact rainfall or temperature on a particular date decades into the future.
Instead, it examines longer-term patterns and possible changes in conditions.
This distinction explains why uncertainty in day-to-day weather forecasts does not automatically invalidate long-term climate projections. They answer different questions and are evaluated using different methods.
Where Do Seasonal Outlooks Fit?
Seasonal outlooks occupy an intermediate position between short-range weather forecasts and long-term climate projections.
They may assess whether temperature or rainfall conditions are more likely to be above, near or below a historical reference over the coming months.
They do not identify the exact weather on every day of the season.
The Met Office notes that the forecasting skill of seasonal outlooks varies by location and time of year. It advises interpreting such outlooks alongside other climate information, more detailed forecasts and relevant warnings.
The following comparison summarizes which information is appropriate for different questions.
|
Question or decision |
Relevant information |
Main limitation |
|---|---|---|
|
Will it rain tomorrow? |
Local weather forecast |
Forecasts contain uncertainty |
|
Is heavy rain expected soon? |
Forecasts and official warnings |
Historical averages cannot replace current warnings |
|
What is the usual weather during a destination's rainy season? |
Local climate normals and historical records |
Averages do not describe exact travel-day conditions |
|
Is the coming season likely to be wetter than usual? |
Seasonal climate outlook |
Forecast skill varies by region and season |
|
Has a region become warmer over several decades? |
Long-term temperature observations and trend analysis |
The record, geographic area and baseline must be examined |
|
What conditions may affect an area several decades ahead? |
Regional climate projections |
Projections describe possible patterns, not exact future daily weather |
|
Did climate change influence a particular extreme event? |
Relevant event-attribution research |
Conclusions depend on the event, evidence and analytical methods |
Some activities benefit from both weather and climate information, provided each is used for its intended purpose.
Does Cold Weather Disprove Climate Change?
No. A cold day, cold week or unusually cold season does not, by itself, disprove long-term global warming.
A local weather observation and a global climate trend represent different geographic and temporal scales.
Earth's climate can warm over several decades while individual locations continue to experience periods of unusually cold weather.
The reverse is also important: an exceptionally hot day does not, by itself, establish the amount of long-term warming that has occurred.
Both observations must be interpreted within the broader evidence.
Why Short-Term Variability Still Occurs
Weather is influenced by interacting atmospheric and climate-system processes.
These processes produce changes between days, seasons, locations and years.
Long-term warming does not eliminate natural variability. It changes the background conditions within which variability occurs.
The Intergovernmental Panel on Climate Change (IPCC), in its Sixth Assessment Report Working Group I assessment published in 2021, concluded that human influence has warmed the atmosphere, ocean and land.
The assessment also found that hot extremes have become more frequent and intense across most land regions since the 1950s, while cold extremes have generally become less frequent and less severe.
These conclusions concern assessed changes over extended periods and broad geographic areas.
They do not imply that every place experiences identical conditions or that cold weather has ceased to occur.
A colder-than-average winter in one location cannot serve as a substitute for examining long-term observations across the planet.
Similarly, a warmer-than-average month in one region should not be presented as a complete measure of global climate change.
The appropriate comparison depends on the claim being made.
Can One Extreme Weather Event Be Linked to Climate Change?
An individual extreme weather event can sometimes be assessed for the influence of human-caused climate change, but the event alone does not provide a complete attribution analysis.
Scientists use event-attribution research to investigate whether human influence has changed the probability or intensity of certain kinds of extreme weather.
An analysis may compare the likelihood or magnitude of an event under present climate conditions with an estimated alternative climate without the relevant human influence.
According to the IPCC's Sixth Assessment Report, researchers have identified human contributions to changes in the probability and intensity of many hot extremes. Attribution findings for other event types can vary by location, event characteristics and available evidence.
This distinction prevents two opposite errors.
The first is assuming that every heatwave, flood, storm or drought was caused entirely by climate change.
The second is assuming that scientists cannot identify a climate-change influence on individual extreme events.
Neither statement accurately reflects the available research.
Event-attribution studies examine specific questions about changes in probability or magnitude. They do not necessarily identify one exclusive cause of everything that occurred.
The distinction is also important when discussing disasters.
The consequences of an extreme weather event depend not only on the physical hazard but also on factors such as where people and infrastructure are located and how vulnerable they are.
Attributing a change in the likelihood of an extreme event is not equivalent to attributing every resulting loss or impact to climate change.
How to Check a Weather or Climate Claim
A weather or climate claim becomes easier to evaluate when its location, timeframe and supporting evidence are identified.
Three questions can reveal whether the information supports the conclusion.
1. What Location Does the Claim Describe?
A local observation should not be mistaken for a global measurement.
For example, a statement about unusually low temperatures in one city concerns conditions in that location.
It cannot, without additional evidence, establish what happened to average temperatures across the entire planet.
The geographic area also matters when comparing regions.
A temperature trend measured at one station may not represent the trend across a much larger region.
Readers should identify whether the information concerns a weather station, town, region, country or global dataset.
2. What Period and Reference Are Being Compared?
The timeframe determines whether the claim concerns short-term weather, seasonal variability or a sustained climate pattern.
A statement about one unusually wet month describes a departure during that period. It does not automatically demonstrate a permanent change in the local climate.
To investigate whether rainfall patterns have changed, a longer observational record and an appropriate analysis are necessary.
The reference period also matters.
A report describing conditions as above normal should specify which historical years were used to establish normal conditions.
Comparisons between different baselines can produce different anomaly values without making either calculation incorrect.
Readers should also check whether the periods being compared are equivalent.
For example, comparing one daily maximum temperature with a long-term average annual temperature would mix different statistical measures.
A meaningful comparison requires attention to the variable, units, period and method.
3. What Kind of Evidence Supports the Conclusion?
Different claims require different kinds of evidence.
A short-range forecast is relevant to a statement about tomorrow's expected rainfall.
Historical weather observations are relevant to a statement about what occurred last month.
A climate normal helps explain whether observed conditions differed from a defined historical reference.
Long-term records and trend analyses are needed to assess sustained changes.
Climate projections address possible future conditions under stated assumptions.
A claim that human-caused climate change influenced an individual extreme event requires relevant attribution evidence.
These sources should not be treated as interchangeable.
For example, a forecast showing unusually high temperatures next week does not independently establish the long-term warming trend of the region.
Conversely, a long-term warming trend does not specify the exact maximum temperature that will occur next Tuesday.
Understanding what each form of evidence can and cannot establish makes it easier to recognize unsupported conclusions.
Understanding Weather and Climate Together
Weather and climate describe related aspects of the atmosphere at different timescales.
Weather tells us what conditions are occurring or expected at a particular time and place. Climate describes the longer-term patterns of those conditions, including averages, seasonal changes, variability and extremes.
The distinction becomes especially important when interpreting unusual weather, comparing temperatures with historical normals or evaluating statements about climate change.
A weather event can provide information about conditions at a particular time. A climate record provides the context needed to understand how those conditions relate to a broader pattern.
Neither should be interpreted without attention to geography, timeframe and the measurements involved.
When reading a weather or climate statement, three checks are useful: what place is being described, what period or reference is being used, and what kind of evidence supports the conclusion?
Those checks help distinguish what an observation shows from what a broader scientific claim requires.
Sources and References
1. UK Met Office. What Is Climate?. Climate Explained. Supports the definitions of climate, variability, extremes and long-term observation.
2. World Meteorological Organization (WMO). WMO Climatological Normals. WMO Knowledge Hub. Defines climatological standard normals and historical reference periods.
3. National Oceanic and Atmospheric Administration (NOAA). Understanding Climate Normals. Explains the 1991–2020 U.S. Climate Normals, calculation procedures and applications.
4. National Oceanic and Atmospheric Administration (NOAA). What's the Difference Between Climate and Weather?. Climate.gov educational resource, updated April 12, 2024. Provides the historical Pacific Northwest heat-event comparison.
5. UK Met Office. The Role of Different Timescales. Explains the different purposes and limitations of weather forecasts and climate projections.
6. UK Met Office. Seasonal Climate Outlooks User Guide. Explains seasonal outlooks, probabilistic forecasting and limitations of forecast skill.
7. Intergovernmental Panel on Climate Change (IPCC). (2021). Climate Change 2021: The Physical Science Basis — Summary for Policymakers. Sixth Assessment Report, Working Group I. Supports assessed conclusions concerning human-caused warming and changes in climate extremes.
8. Intergovernmental Panel on Climate Change (IPCC). (2021). Climate Change 2021: The Physical Science Basis — Chapter 11, Weather and Climate Extreme Events in a Changing Climate. Sixth Assessment Report, Working Group I. Supports the discussion of event attribution, changes in extreme-weather probability and intensity, and disaster impacts.




Comments 0
No comments yet. Be the first to start the conversation.