



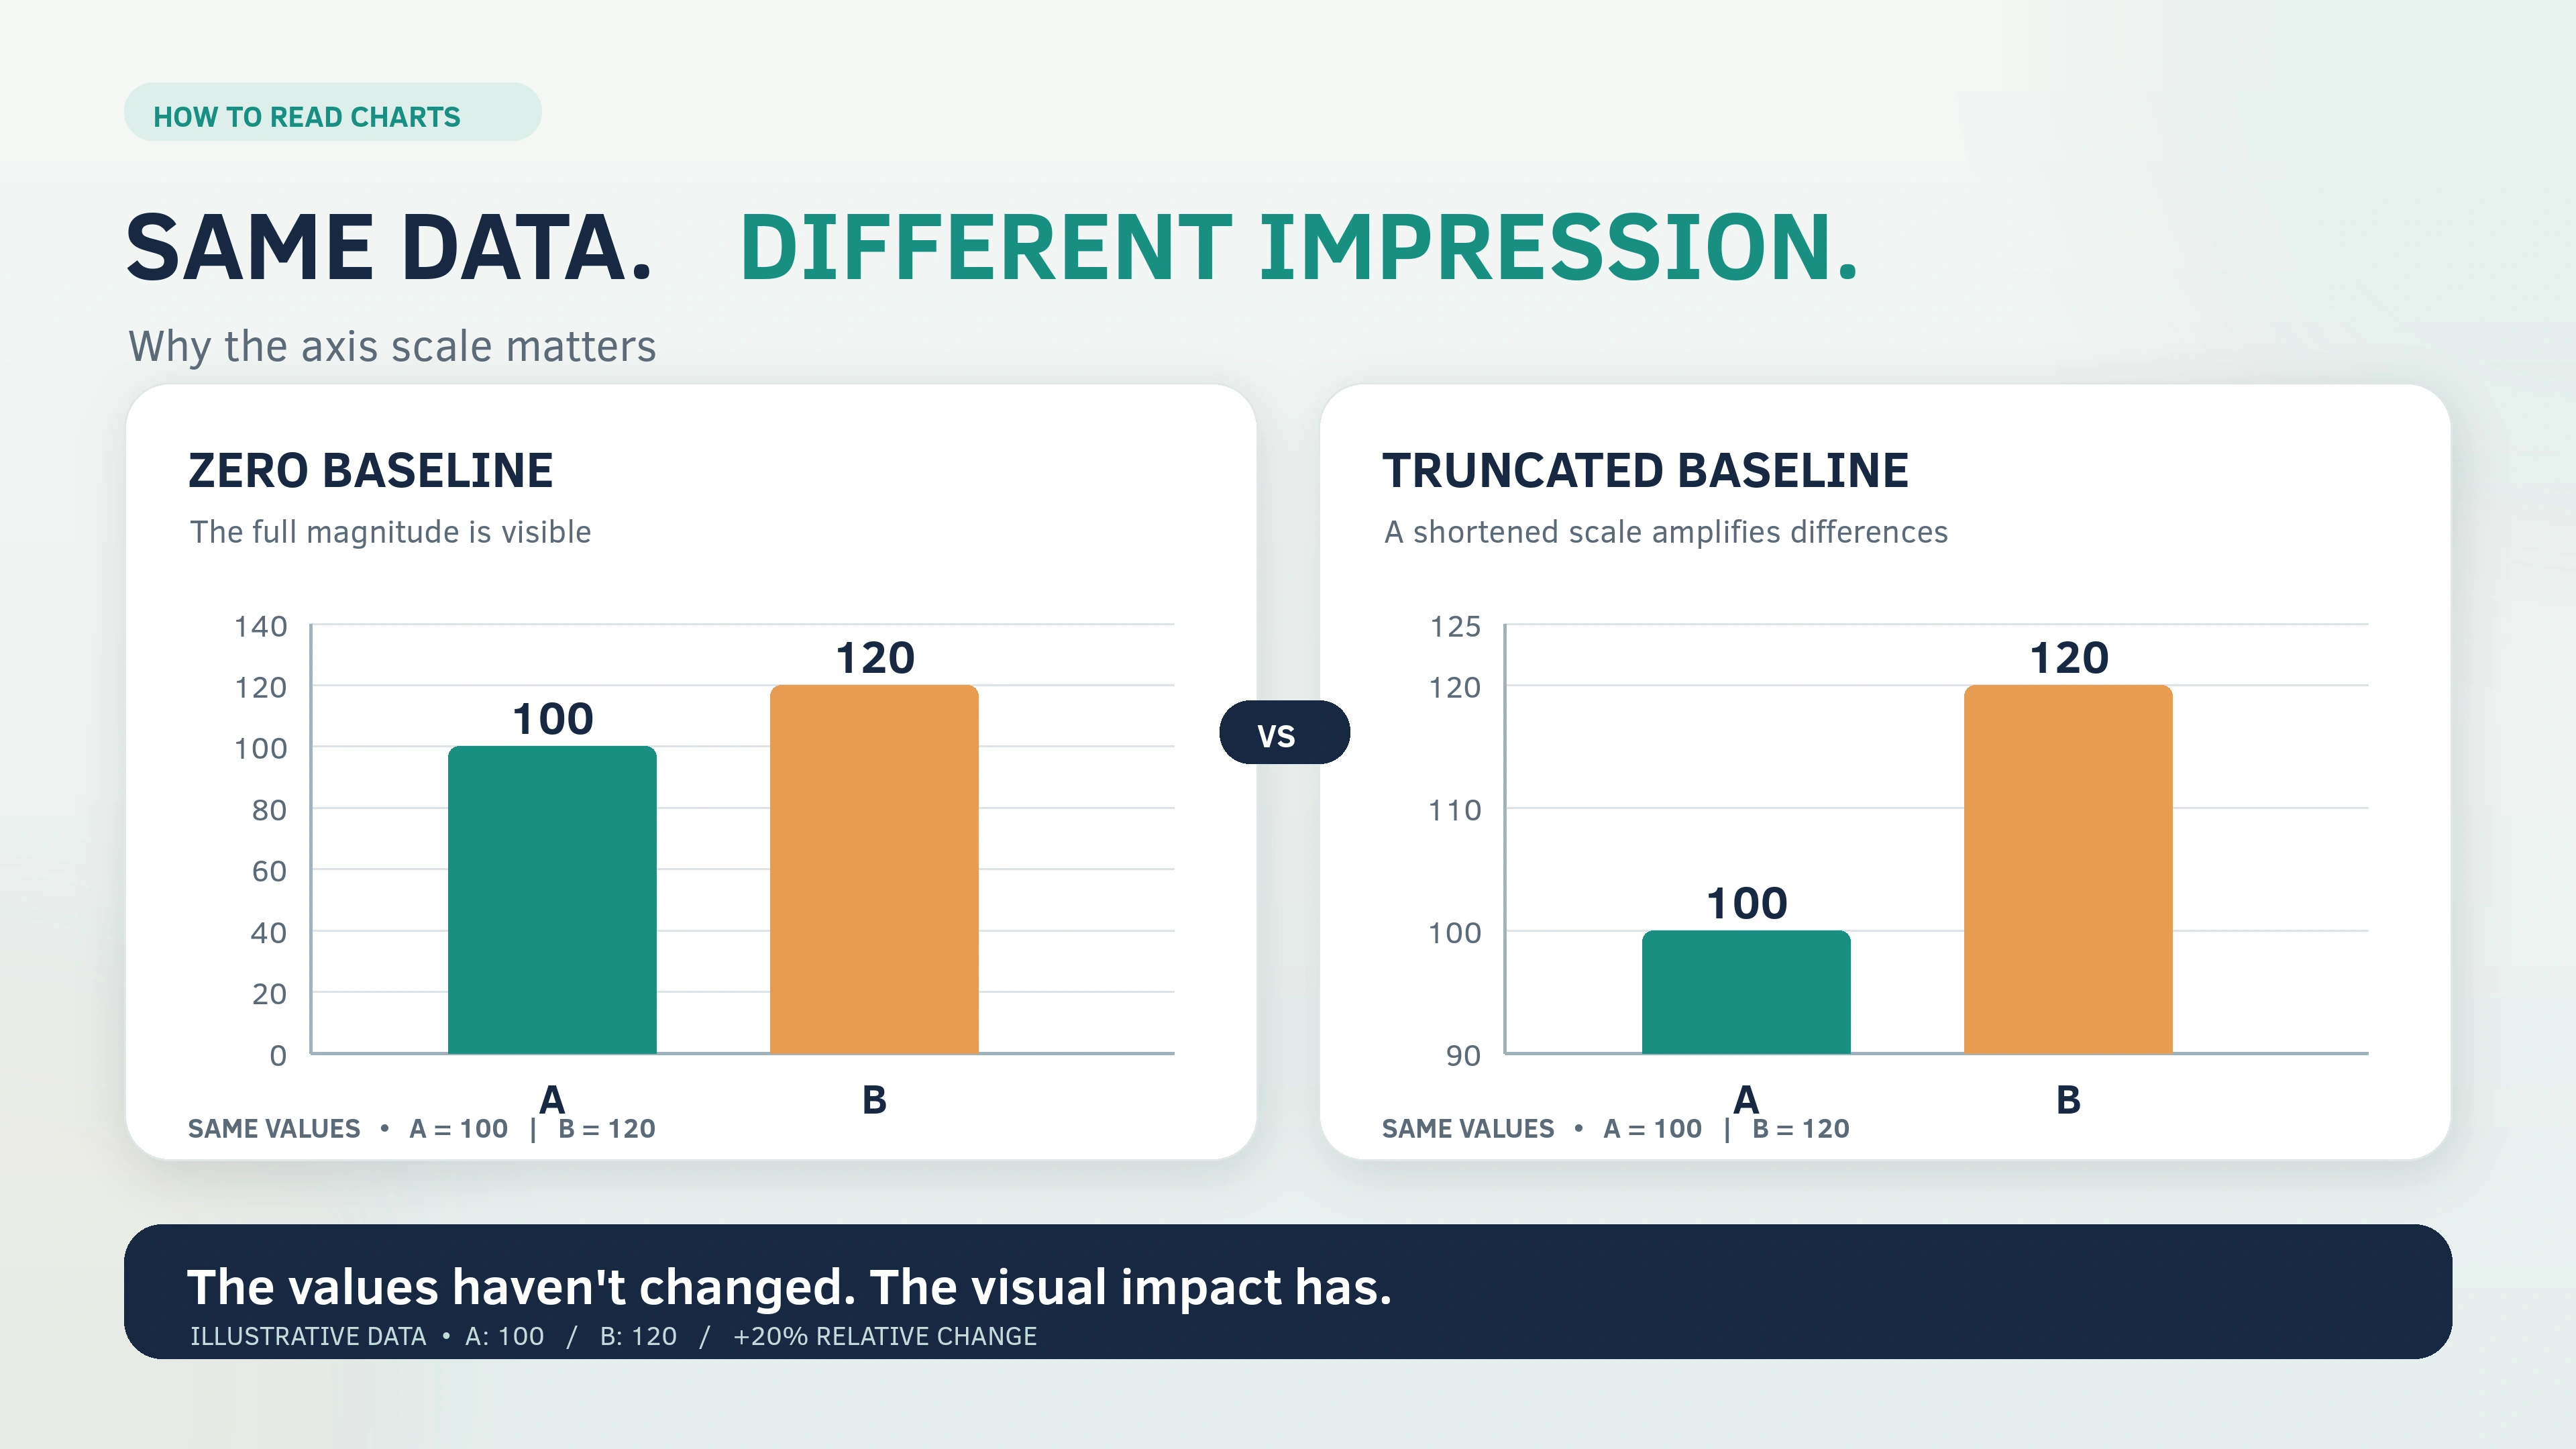
A chart can use accurate numbers and still give a misleading impression. A shortened axis can make a modest increase look dramatic. A percentage can suggest a decline even when the underlying amount has increased. Two lines can move together without proving that one variable caused the other to change.
Learning how to read charts and graphs without being misled means checking more than the visible pattern. You need to understand what the chart measures, how its design represents the numbers, and whether the conclusion follows from the evidence.
These skills apply to classroom graphs, research reports, public statistics, workplace dashboards and charts shared online. They are part of broader data literacy, but interpreting a particular graph requires a focused set of checks.
The process begins with the labels and numerical scale. It then moves to the underlying population, percentages, time periods, uncertainty and original source.
An unfamiliar chart format is not automatically misleading. The goal is to recognise when a visual presentation supports an accurate comparison, when it requires additional context, and when the available information is insufficient for a reliable conclusion.
Answer Summary: To read a chart accurately, identify its measured variable, units, population, dates, axes, legend and source. Check whether the scale and visual design represent numerical differences fairly. Examine the denominator behind percentages, compare equivalent groups, and account for missing information or uncertainty. Finally, separate what the chart directly shows from explanations it cannot establish. A misleading impression does not necessarily mean the underlying data are false or that the chart was deliberately manipulated.
Key Takeaways:
-
Read titles, axis labels, units, legends and source notes before interpreting the visual pattern.
-
Check bar-chart baselines, time intervals and numerical scales.
-
Understand the denominator behind every percentage or rate.
-
Distinguish absolute amounts from proportions and relative changes.
-
Treat correlation, estimates and uncertainty with appropriate caution.
-
Compare a chart's numerical evidence with the conclusion attached to it.
-
Trace screenshots to their original source when important information is missing.
1. What Should You Check When Reading a Chart?
Start by identifying what the chart measures. Its shapes and colours have limited meaning until you understand the quantities they represent.
A chart communicates through two connected elements: the data displayed visually and the explanatory information surrounding it.
Google's guidance on visualization traps distinguishes between graphical content and supporting elements such as titles, labels, legends and axes. Both affect how accurately readers interpret a visualisation.
Read the title, axes, units and legend
Begin with the title. It should identify the subject, but it may not explain the population, measurement method or full context.
Next, examine the axes.
In a conventional vertical bar or line chart, the horizontal axis, called the x-axis, often shows categories or time. The vertical axis, called the y-axis, usually represents numerical values.
In a horizontal bar chart, the numerical scale generally runs along the x-axis.
The important question is which axis represents the measured quantity.
Check the following information:
-
Title: What subject or relationship does the chart describe?
-
Axis labels: Which variables are being measured?
-
Units: Are the values counts, percentages, rates, currency amounts or another measurement?
-
Legend: What do the colours, lines, symbols or patterns represent?
-
Dates: What period does the chart cover?
-
Source: Who collected or published the data?
-
Notes: Are there definitions, estimates, exclusions or methodological qualifications?
Units deserve particular attention.
An axis labelled in millions represents a different magnitude from one showing individual observations. Similarly, a rate measured per 100,000 people cannot be interpreted as an absolute count.
A chart may accurately show the direction of a trend while leaving its numerical significance unclear if essential units are missing.
Identify exactly what is being counted
The same subject can be measured in several ways.
A chart about education, for example, may show student enrolment, examination participation, completion rates or average scores.
Those measurements answer different questions.
A count describes the number of recorded observations. A percentage expresses a proportion of a defined total. A rate relates occurrences to a particular population, exposure or period.
An average summarises numerical observations, but it does not necessarily describe what happened to every member of the group.
Before interpreting a graph, identify its population: who or what was included in the data.
If a survey covers a particular group of respondents, its findings do not automatically describe everyone in the wider population.
Figure.NZ's chart-reading guidance recommends checking definitions, collection methods and source information because these details determine what the displayed values mean.
Separate observation from explanation
Describe the numerical pattern before deciding what caused it.
For a line chart, you may observe that the measured value increased between two dates. That is a description of the data.
Claiming that a particular policy, event or behaviour caused the increase is a different statement.
The explanation requires evidence beyond the upward line.
A useful distinction is between what the chart directly establishes and what the accompanying commentary asks readers to believe.
If the commentary makes a stronger claim than the data support, the problem may lie in the interpretation rather than the graph itself.
2. How Different Chart Types Affect Interpretation
Different charts represent different relationships. Understanding what each format is designed to show makes it easier to recognise when its presentation or interpretation is unsuitable.
Bar charts compare numerical magnitudes
Bar charts commonly compare values across categories.
The length of each bar represents the measured quantity. When the bars use the same scale, their lengths communicate relative size.
Readers should check the category labels, numerical axis and baseline.
A bar chart can exaggerate differences when its numerical axis starts above zero, because the visible lengths no longer represent the complete quantities.
Line graphs show change over an ordered sequence
Line graphs are commonly used to display changes over time.
Each point represents a measured value. Connecting lines help readers follow the overall direction of change.
An upward line indicates an increase in the measured variable, but whether that increase represents improvement or deterioration depends on the subject.
The spacing between dates also matters.
When observations occur at irregular intervals, equal horizontal spacing can misrepresent how quickly changes occurred.
Pie charts show parts of a whole
A pie chart divides a defined total into proportional categories.
Each slice represents a share of that total.
The central question is what the whole circle represents.
Two pie charts can show the same categories while referring to different total amounts. Their slice sizes therefore cannot establish whether the absolute quantity in a category increased or decreased.
This distinction becomes particularly important when comparing different years.
Scatter plots show associations between paired values
A scatter plot positions observations using two numerical variables.
The distribution of points can reveal positive or negative associations, clusters, unusual observations or the absence of an obvious relationship.
However, the pattern does not independently establish causation.
Readers should also determine what each plotted point represents. It may describe an individual observation, a geographical area or an average for a group.
These different units of analysis can affect the interpretation.
Indexed charts compare relative change
An indexed chart expresses values relative to a specified reference period.
If the index starts at 100, a later value of 110 means the measured quantity is 10% higher than its reference value.
It does not mean there were 110 people or 110 units.
Indexed charts are useful when comparing relative changes in quantities that have different starting values.
Their limitation is that equal index values do not indicate equal absolute amounts.
To interpret an indexed graph, identify its base period and remember that the plotted values represent relative movement.
3. How Scales and Visual Design Can Mislead
A chart's scale determines how numerical differences appear. Changing the scale can substantially alter the visual impression without changing the underlying numbers.
Why a truncated axis exaggerates differences
A truncated axis starts above zero or omits part of the numerical range.
This is particularly important in bar charts.
Readers interpret bar length as an indication of magnitude. When the lower part of the scale is removed, the difference between the visible bar lengths can seem disproportionately large.
The underlying figures may remain correct, but the presentation can exaggerate their relative difference.
The UK's Office for National Statistics (ONS) recommends zero baselines for conventional bar and area charts because their lengths or filled areas represent numerical quantities.
Some charts show an axis break using a gap or zigzag symbol. Others begin above zero without a prominent warning.
Reading the first numerical value on the axis is more dependable than looking for a particular visual marker.
Should every graph start at zero?
No. The appropriate starting point depends on how the chart represents values.
A zero baseline is important for ordinary bar charts because the complete bar length communicates magnitude.
Line graphs and scatter plots work differently. Their plotted points do not necessarily represent lengths extending from zero.
A line graph may use a shortened vertical range to reveal relatively small but meaningful variations.
The ONS recognises this distinction, allowing a cropped numerical axis for line charts and scatter plots when it makes the data easier to interpret.
The important questions are whether the scale is clearly disclosed and whether the presentation exaggerates the practical importance of the variation.
A non-zero axis is not sufficient evidence that a chart is misleading.
Check whether time intervals are evenly represented
The horizontal scale can also change how a trend appears.
Suppose a graph contains observations from several years, but those observations were not collected at regular intervals.
If the dates are displayed at equal distances despite unequal elapsed time, the line's apparent slope no longer represents the actual rate of change over time.
The UK House of Commons Library demonstrates this problem using published Northern Ireland fuel-poverty data.
Its comparison shows how removing gaps between observation years can make changes appear more abrupt than they do when the horizontal spacing reflects elapsed time.
This is an educational illustration of a presentation problem, not proof that the underlying figures were incorrect.
Missing observations create another difficulty.
A continuous line may suggest that values were recorded throughout a period even when some observations are unavailable.
The ONS recommends showing gaps where otherwise regular observations are missing, rather than implying uninterrupted measurement.
Also examine the beginning and end of a time series.
A short date range may be suitable for analysing a particular interval, but it may not establish a long-term trend.
Understand logarithmic scales before interpreting slopes
A logarithmic scale represents multiplicative changes at equal graphical distances.
On a linear scale, equal distances represent equal numerical differences.
On a logarithmic scale, equal distances represent equal multiplication factors.
For example, a logarithmic axis may show 1, 10, 100 and 1,000 at evenly spaced positions.
This allows a wide range of values to appear on one graph.
It also changes how slopes should be interpreted.
A straight upward line on a logarithmic graph can represent a constant proportional rate of growth rather than a constant numerical increase.
Logarithmic scales are legitimate analytical tools, but readers must identify them before interpreting absolute differences.
Check the axis labels and numerical increments rather than assuming that every graph uses a linear scale.
Examine dual-axis charts and decorative effects
A dual-axis chart displays two numerical variables using separate scales, often positioned on opposite sides of the graph.
The two lines may appear to rise together, cross or occupy similar positions.
However, adjusting either numerical scale can change those visual relationships without changing the recorded data.
A crossing point does not necessarily mean the variables have equal numerical values.
The ONS advises caution with dual-axis charts and recommends separate charts where that improves clarity.
Three-dimensional effects introduce another difficulty.
Perspective can make bars, columns or pie slices harder to compare. The viewer may struggle to identify which visible edge represents the measured value.
Google's visualization guidance also identifies aspect ratios, three-dimensional presentation and colour choices as features capable of creating misleading impressions.
When a chart uses decorative depth, rely on clearly labelled numerical values rather than visual perspective alone.
4. Why Percentages and Comparison Groups Matter
A graph can be visually accurate but analytically incomplete.
This happens when the displayed numbers have different denominators, the comparison groups are inconsistent, or important background information is missing.
Check the denominator behind percentages
A percentage expresses a proportion of a defined total.
That total is called the denominator.
Without identifying it, a percentage has limited meaning.
For example, a percentage calculated from all enrolled students is not directly equivalent to a percentage calculated from students who completed an examination.
Both may be mathematically correct, but they refer to different populations.
The same distinction applies to rates.
A count of occurrences may increase while the corresponding rate decreases if the relevant population or exposure changes sufficiently.
To compare percentages or rates responsibly, determine whether the denominators are equivalent.
If they differ, consider whether a standardised comparison is available.
Distinguish percentage points from percentage change
Percentage-point changes and relative percentage changes describe different quantities.
For an arithmetic illustration, consider a hypothetical percentage rising from 40% to 50%.
The increase is 10 percentage points.
The relative percentage increase is 25%, calculated by dividing the 10-point difference by the original 40% value.
These are two mathematically correct descriptions of the same hypothetical change.
They answer different questions.
A statement that a rate increased by 10% would be incorrect if the intended meaning were an increase of 10 percentage points.
When interpreting a graph, check which calculation supports the accompanying description.
A smaller pie slice does not necessarily mean a smaller amount
A documented example appears in the UK House of Commons Library's March 2026 chart-reading briefing.
The Library compares UK public expenditure on transport in the financial years 2019–20 and 2023–24.
Its pie charts show that the proportion of transport expenditure allocated to roads was smaller in the later year.
However, the absolute amount spent on roads increased.
The two observations are consistent because overall transport expenditure increased proportionately more than expenditure on roads.
The important distinction is between a category's share of a total and the category's absolute amount.
A shrinking share does not establish a reduction in spending, participation or any other measured quantity.
When comparing pie charts from different periods, look for the underlying totals and category values.
If those figures are unavailable, the graphic may support conclusions about relative composition without establishing absolute changes.
Check whether definitions changed over time
Data collected in different periods are not necessarily directly comparable.
Definitions, collection methods and reporting categories can change.
Figure.NZ illustrates this issue using New Zealand population data that distinguish between de facto population and resident population.
The first concept concerns people present in the country. The second concerns people who normally live there.
These are not identical population definitions.
A chart combining measurements based on different definitions requires the distinction to be explained.
Otherwise, a reader may interpret a change in measurement as a change in the underlying population.
Metadata, methodology notes and definitions are therefore part of the evidence, not optional background reading.
5. What Charts Cannot Establish From Data Alone
A graph may accurately represent the available observations while leaving important questions unanswered.
Its conclusions depend on the quality of the data, the measurement method, the statistical analysis and the scope of the underlying research.
An average can conceal differences between groups
An overall average summarises observations, but it may obscure differences within the population.
The same applies to aggregate percentages and rates.
When groups differ in composition, their combined results can tell a different story from their subgroup results.
Readers should consider whether the chart combines populations that have substantially different characteristics or conditions.
For example, an overall comparison involving multiple departments or regions may require separate analysis when the groups differ in size or composition.
The relevant question is whether the aggregation preserves the comparison needed to answer the original research question.
A chart is not necessarily inaccurate because it uses combined data. The problem arises when the aggregate supports a conclusion that does not adequately account for meaningful subgroup differences.
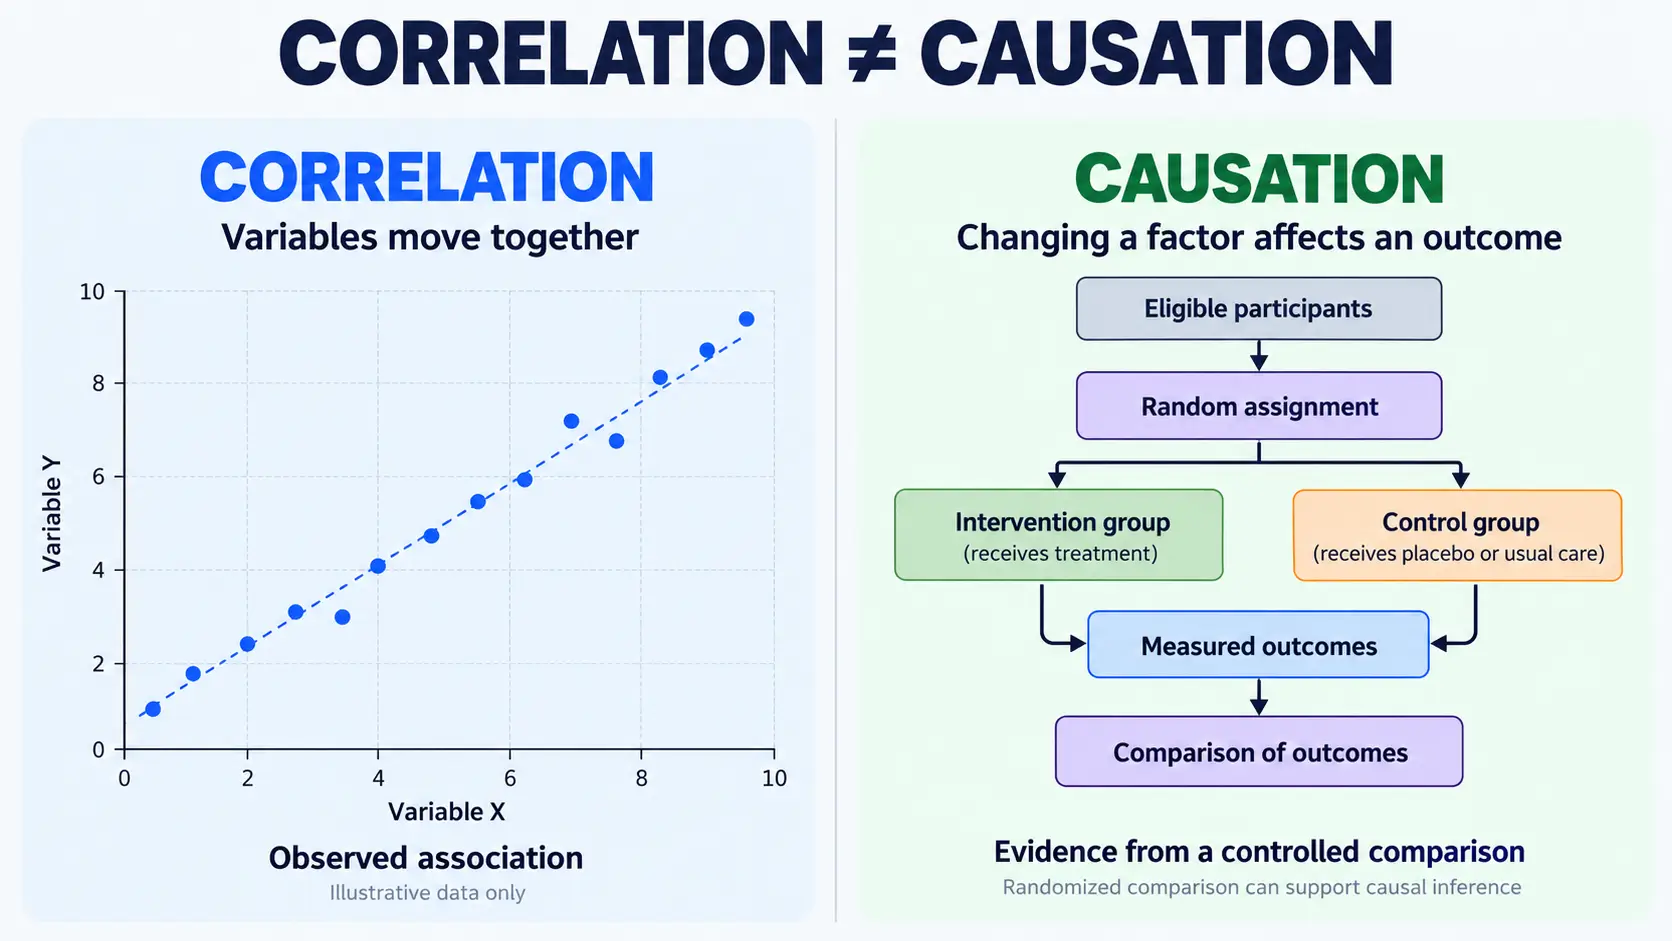
Correlation does not prove causation
Two variables can move together without one causing the other to change.
A scatter plot may show that higher values of one variable are associated with higher values of another.
Two time-series lines may rise or fall during similar periods.
These patterns establish observations about association.
They do not independently identify the mechanism responsible.
Other relevant variables, common underlying influences, measurement decisions or coincidental patterns may affect the relationship.
A causal conclusion requires research methods and evidence suited to investigating cause and effect.
Before accepting a chart's explanation, ask whether the source reports an association or provides evidence supporting a causal interpretation.
Sample estimates are not exact population measurements
Some charts display complete recorded counts, while others present estimates derived from samples.
A sample represents part of a larger population.
Statistical estimates based on samples contain uncertainty because the measured observations do not include every member of the population.
The size and characteristics of the sample, as well as the research design, affect how confidently the estimate can be interpreted.
Administrative counts have different potential limitations, including omissions, recording errors and subsequent revisions.
Neither type of measurement should automatically be treated as free from error.
Readers should identify whether a graph displays observed counts, survey estimates, modelled results or another type of measurement.
Error bars do not have one universal meaning
Error bars represent variability or uncertainty, but their exact meaning depends on the method used.
They may show confidence intervals, standard errors, standard deviations or other defined quantities.
A confidence interval is calculated using a statistical procedure intended to provide information about the uncertainty of an estimate.
It should not be interpreted as a guarantee that the true population value lies inside the displayed range.
The ONS recommends presenting uncertainty when it materially affects the interpretation, while recognising that additional graphical information can make a chart harder to read.
Overlapping error bars also require care.
Pew Research Center explains that overlap between survey margins of error does not provide a universal test of statistical significance.
Depending on the research design and statistical relationships between estimates, overlapping intervals may still accompany a statistically significant difference.
Determining whether a difference is significant can require additional calculation.
Another limitation concerns what the error bars capture.
Survey margins of sampling error do not account for every possible source of inaccuracy, including nonresponse bias or differences in how participants interpret questions.
An estimate can therefore appear statistically precise while remaining subject to other measurement limitations.
Statistical significance is not the same as practical importance
A statistically detectable difference is not necessarily important for every real-world decision.
Similarly, a relatively small numerical change may matter substantially in a particular context.
The importance of a result depends on its measured size, uncertainty, subject and intended use.
A steep line or striking difference in bar heights cannot establish practical importance on its own.
Readers need to consider what the measurement represents and what consequences, if any, follow from the observed change.
6. A Documented Example of Misleading Graph Design
One way to understand misleading charts is to compare two presentations of the same data.
The UK House of Commons Library provides such an illustration in its briefing How to read potentially confusing charts, published on 17 March 2026.
Two charts showing the same admissions trend
The Library presents a pair of charts using accepted-applicant data from UCAS, the UK's Universities and Colleges Admissions Service.
Both charts represent the same underlying observations.
The first chart uses a vertical axis beginning at zero.
The second uses a shortened vertical axis beginning at 0.4 million.
According to the Library's explanation, the shortened version can create an initial impression of approximately 150% growth in accepted applicants.
The Library reports that the underlying increase was 22%.
These figures describe the Library's published educational illustration. The 22% figure is attributed to that briefing rather than presented as a separately recalculated result.
The example demonstrates how scale selection changes the appearance of a numerical trend.
It does not establish that a particular publisher deliberately used the shortened version to deceive readers.
How to interpret the comparison
The first task is to identify the measured quantity: accepted applicants.
Next, read the numerical labels on the vertical axes.
The full-scale chart positions the values relative to zero.
The shortened chart removes the lower part of the numerical range, making the difference occupy a greater proportion of the displayed height.
The values being represented have not changed.
What changes is the visual emphasis placed on their difference.
The shortened chart therefore produces an apparent increase that is much larger than the numerical growth reported by the Library.
A reader comparing the two versions should rely on the underlying values and the calculation of relative change rather than the apparent height difference.
What the example proves—and what it does not
The published illustration supports three conclusions.
First, the accepted-applicant series increased over the period represented.
Second, shortening the vertical axis makes that increase appear disproportionately large.
Third, the chart alone does not explain why the admissions total increased.
The causal question would require additional evidence about the relevant circumstances.
This distinction matters because correcting the graphical presentation does not automatically establish a complete interpretation of the underlying data.
The appropriate reading is that the recorded series increased, while the shortened axis exaggerated the visual impression of that increase.
Why comparing corrected charts can help
Research has examined whether showing corrected versions of misleading graphs can improve readers' judgments.
A 2026 study by Winnifred Wijnker and colleagues, published in PLOS ONE, investigated how vocationally educated young adults in the Netherlands interpreted misleading graphs.
The study included a think-aloud investigation with 10 participants and a questionnaire involving 130 participants. Its data were collected in 2023.
Within the studied conditions, seeing corrected graphs reduced misleading interpretations and helped participants evaluate new misleading graphs of the same types.
The findings concern a specific participant population and experimental setting.
They do not establish that graph corrections work equally well for every reader or every chart format.
Nevertheless, the research provides evidence for a useful educational approach: examine the original presentation alongside a clearer representation of the same information.
7. How to Verify a Chart Before Relying on It
Recognising a questionable visual design is one task. Determining whether its underlying evidence is reliable is another.
A practical chart review can be completed in two stages.
First pass: read the chart itself
Begin with the information visible on the page.
Determine what the chart measures, the population it represents and the numerical units.
Check the axis starting points, intervals and dates.
Identify the chart type and consider whether its design suits the comparison.
Then describe the displayed pattern in plain language, without adding an explanation that the chart has not established.
If exact values are available, use them instead of estimating the magnitude from the visual shape.
Second pass: examine the evidence behind the chart
Look for information that the graphic may not fully explain.
The most relevant questions concern population definitions, denominators, source data and statistical uncertainty.
Determine whether the compared groups were measured consistently.
If the chart displays an estimate, investigate how that estimate was produced and whether relevant uncertainty is reported.
Finally, examine the interpretation attached to the graph.
Does it describe the measured pattern accurately, or does it make a stronger statement about causes, effects or future outcomes?
The answer may be that the chart supports a limited conclusion but not the broader claim.
That is a valid analytical result.
How to verify a chart shown only in a screenshot
A screenshot may exclude information essential to understanding the original chart.
The missing material may include the source, complete numerical scale, dates, footnotes, title or methodology.
To investigate:
-
Identify distinctive wording from the title, labels or source note.
-
Search for the original report or organisation responsible for the data.
-
Compare the screenshot with the complete published chart.
-
Check whether the image omits dates, labels, scale values or explanatory notes.
-
Examine the original dataset or methodology when the conclusion depends on details not visible in the image.
For related source-checking methods, see Collegenp's article on checking claims in online content.
A screenshot without an identifiable source does not establish that the information is false.
However, missing provenance limits independent verification.
Readers should distinguish what is visibly presented from what they can confirm using the original evidence.
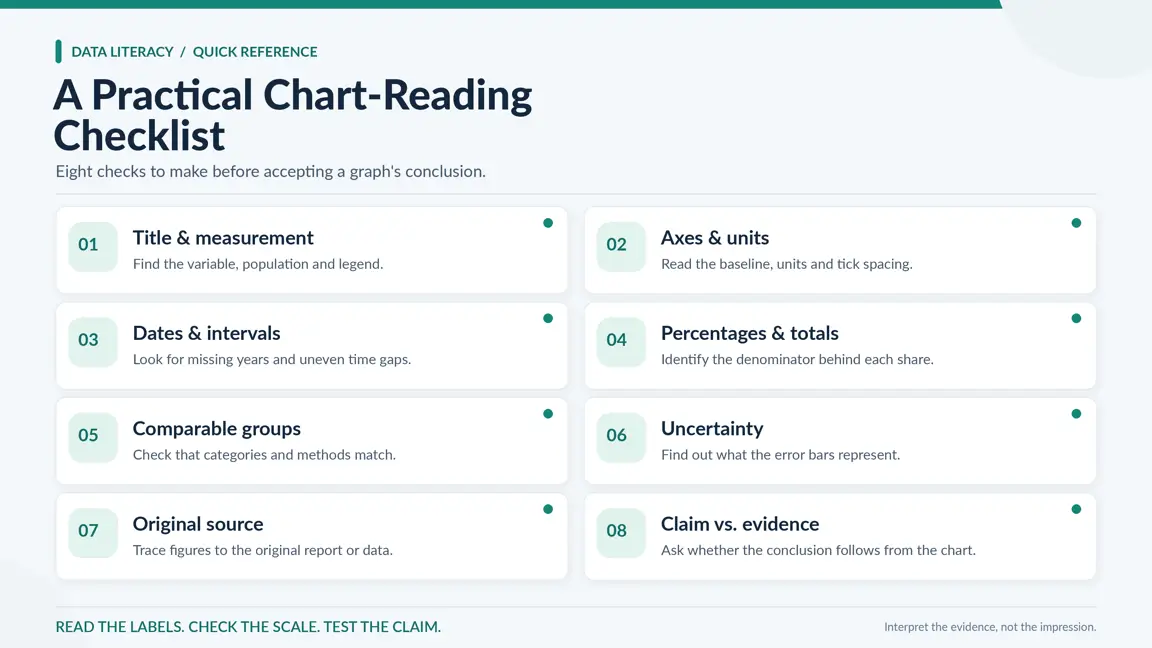
A practical chart-reading checklist
|
Check |
Why it matters |
What to examine |
|---|---|---|
|
Title and measurement |
Identifies the subject |
Quantity, percentage, rate or estimate |
|
Axes and units |
Establishes numerical meaning |
Baseline, scale, increments and units |
|
Dates |
Defines the period |
Missing years, irregular intervals and selected endpoints |
|
Denominator |
Gives percentages context |
Population or total used for calculation |
|
Comparison groups |
Determines whether values are comparable |
Definitions, composition and measurement methods |
|
Uncertainty |
Limits confidence in estimates |
Error-bar meaning, intervals and relevant methodology |
|
Source |
Supports verification |
Original publisher, dataset and collection method |
|
Conclusion |
Tests the interpretation |
Whether the claim follows from the displayed evidence |
A brief review may be enough when the graph is straightforward, its source is clear and its conclusion is limited to an observable pattern.
A more detailed examination becomes important when the chart supports a consequential claim or contains unfamiliar scales, incomplete information or inconsistent comparisons.
If the underlying information cannot be verified, an appropriately limited conclusion is more defensible than filling the gaps with assumptions.
Conclusion
Reading charts accurately requires more than recognising whether a line rises or a bar is longer.
The numerical scale determines how differences appear. Percentages depend on denominators. Time intervals, changing definitions, subgroup composition and statistical uncertainty can affect interpretation even when the displayed values are correct.
A graph may be misleading because of its design, incomplete context or an unsupported conclusion. These are different problems and should be evaluated separately.
The most dependable approach is to read the measurements, examine the presentation and test whether the attached claim follows from the evidence.
When that connection is unclear, trace the original source before accepting or repeating the conclusion.
These habits also support the wider practice of learning to verify claims before sharing, especially when an eye-catching graphic circulates without its original context.
Referecnces
1. Bolton, Paul (2026). How to read potentially confusing charts. UK House of Commons Library, 17 March 2026.
2. Office for National Statistics. Axes and gridlines. ONS Data Visualisation Service Manual.
3. Office for National Statistics. Line chart. ONS Data Visualisation Service Manual.
4. Office for National Statistics. Showing uncertainty in charts. ONS Data Visualisation Service Manual.
5. Google for Developers. Visualization traps. Google Machine Learning Guides.
6. Figure.NZ. Basics of reading a chart. Figure.NZ Learning Guides.
7. Smith, Gregory A. (2025). Understanding error bars in charts. Pew Research Center, 16 September 2025.
8. Wijnker, W., Burger, P., Smeets, I., and Willems, S. (2026). Debunking misleading graphs effectively: How vocationally educated young adults perceive graphs. PLOS ONE, 21(2), e0340100.






Comments 0
No comments yet. Be the first to start the conversation.