



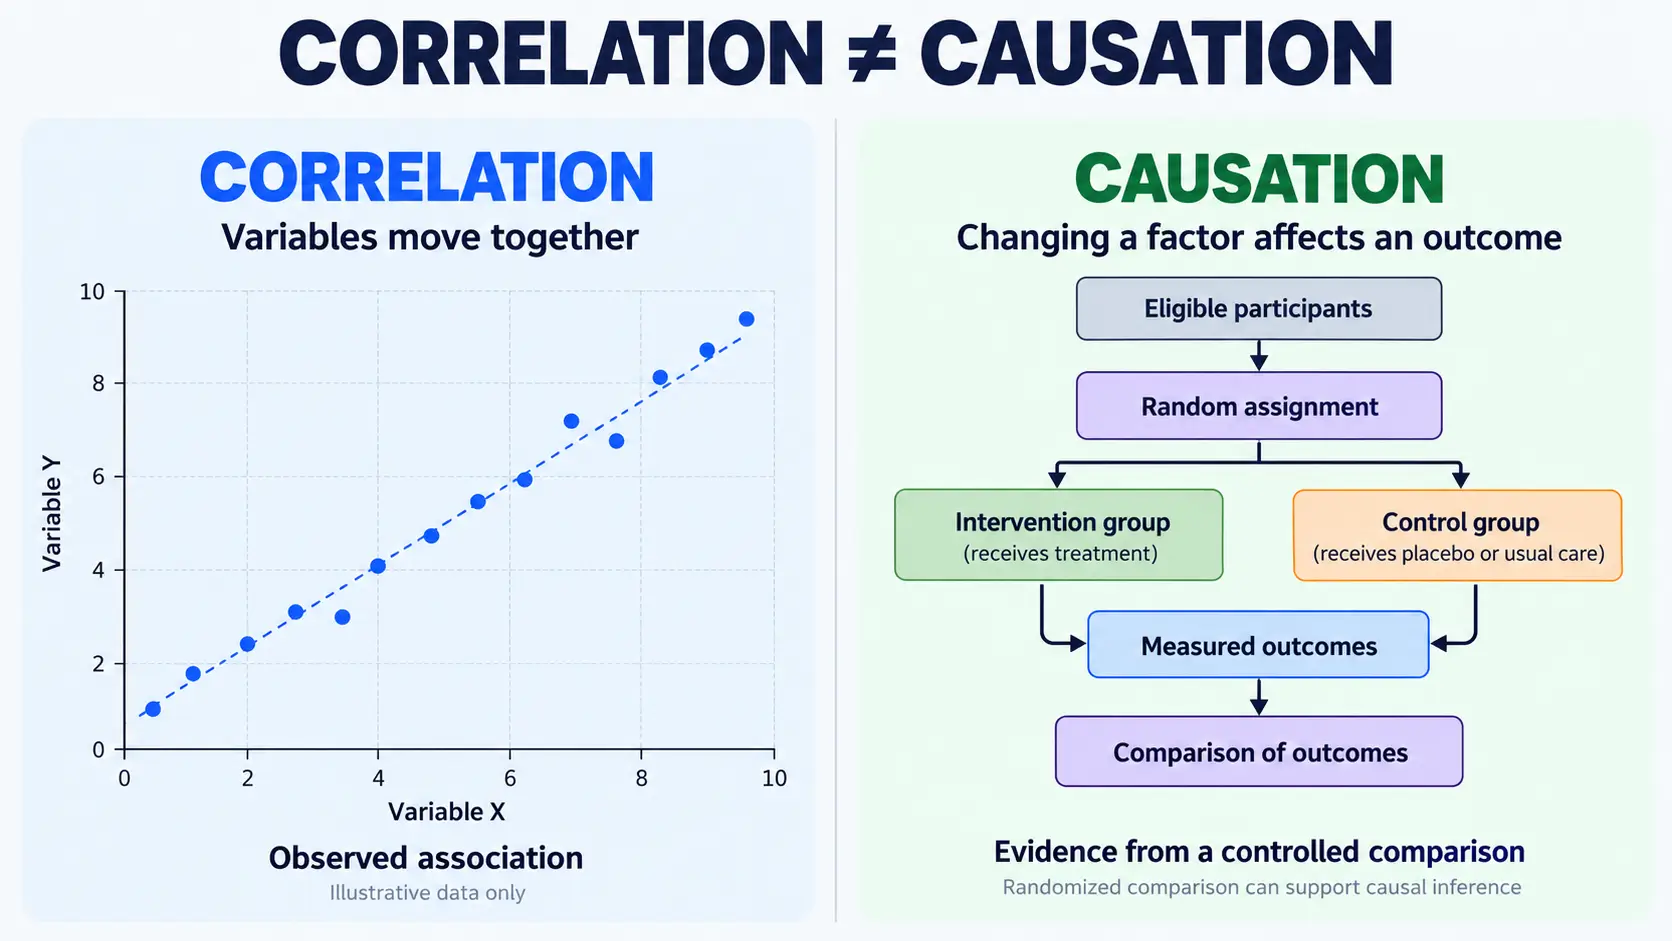
Correlation means that two variables are related in observed data. Causation means that one factor influences an outcome, so changing that factor can make a difference to what happens.
The distinction matters because finding a relationship is not the same as explaining it.
A graph may show two variables increasing together. A study may report a strong statistical association. A headline may suggest that one behavior improves performance or that a particular condition produces an outcome. Yet none of these observations, by itself, establishes cause and effect.
Consider an educational study reporting that students who receive tutoring have lower examination scores than those who do not. Does this mean tutoring reduces achievement? Or were students experiencing academic difficulties more likely to seek tutoring in the first place?
Both interpretations concern the same observed association, but they imply different causal explanations.
Understanding correlation versus causation helps readers evaluate such claims without dismissing useful evidence or accepting conclusions that go beyond what the research supports.
The central task is to distinguish what was observed from what would happen if the proposed cause were changed. Doing this requires attention to study design, timing, comparison groups, alternative explanations, and statistical uncertainty.
Answer Summary: Correlation describes an observed relationship between variables, while causation concerns whether changing one factor affects another. A correlation may reflect a genuine causal effect, a shared underlying cause, reverse causation, chance, or bias. To distinguish these possibilities, examine how the evidence was collected, whether the proposed cause came before the outcome, what alternative explanations exist, and whether the research supports a credible causal comparison. Strong correlations alone do not establish causation.
Key Takeaways:-
Correlation identifies a statistical relationship; causation concerns cause and effect.
-
A correlation coefficient cannot establish which variable influences the other.
-
Confounding, reverse causation, chance, and bias can produce misleading associations.
-
Randomized experiments can provide strong causal evidence when properly designed.
-
Observational research can support causal conclusions under suitable conditions and assumptions.
-
Statistical significance does not establish causation or practical importance.
-
Reliable causal interpretation requires attention to study design, competing explanations, and uncertainty.
What Is the Difference Between Correlation and Causation?
The difference between correlation and causation is the difference between observing a relationship and determining whether one factor produces an effect.
Both concepts concern relationships between variables, but they answer different questions.
What is correlation?
Correlation is a statistical relationship between variables.
A variable is a characteristic that can take different values, such as temperature, age, examination score, or time spent studying.
When two variables are correlated, their values display a pattern of association.
For example, researchers examining study time and examination scores may find that students who report more study time tend to have higher scores.
That finding establishes an association within the observed data. It does not independently establish that the additional study time caused the higher scores.
Other factors, including prior knowledge, instructional support, and differences in learning circumstances, may affect the relationship.
Correlation therefore describes a pattern without necessarily explaining its origin.
The term association has a broader statistical meaning than correlation. It can describe relationships involving categorical variables or patterns that are not linear. Although the words are sometimes used interchangeably in general discussion, the distinction matters when interpreting specific statistical measures.
What is causation?
Causation occurs when a factor influences an outcome.
A causal question asks whether the outcome would differ if the proposed cause were changed under relevant conditions.
For instance, researchers evaluating an instructional method want to know whether the method itself changes student learning outcomes.
Finding that students using the method achieve higher scores than other students does not automatically answer that question.
The groups may have differed before the instruction began.
To assess the method's causal effect, researchers need a credible comparison between what happened with the method and what would have happened without it.
This introduces the idea of a counterfactual: an alternative outcome under a different condition.
Researchers ordinarily cannot observe the same individual under two mutually exclusive conditions at precisely the same time. Instead, they use study designs and analytical methods to estimate what the alternative outcome would have been.
The distinction between passive observation and intervention is a central subject in the causal-inference chapter of Fairness and Machine Learning.
Causation does not mean that one factor must be the sole explanation for an outcome. Several causes may contribute, and their effects can differ across people or circumstances.
Correlation vs causation at a glance
|
Correlation |
Causation |
|---|---|
|
Describes an observed relationship |
Describes a cause-and-effect relationship |
|
Shows how variables vary together |
Concerns how changing a factor affects an outcome |
|
Does not identify causal direction |
Requires a defensible account of causal direction |
|
Can arise without a direct causal relationship |
Represents an effect of the proposed cause |
|
Can support prediction |
Can inform decisions about interventions |
|
Can be summarized using statistical measures |
Requires suitable causal comparisons and assumptions |
A correlation can be useful evidence. The mistake occurs when the relationship is interpreted as causal without adequate justification.
Understanding Positive, Negative, and Zero Correlation
Correlation can be positive, negative, or close to zero, depending on the pattern between the variables.
One widely used measure is Pearson's correlation coefficient, represented by \(r\).
It describes the direction and strength of a linear relationship between two quantitative variables.
Positive correlation
A positive correlation occurs when higher values of one variable tend to accompany higher values of another.
Pearson's coefficient is positive in this situation.
The association does not establish why the variables increase together.
One variable may influence the other, both may be influenced by another factor, or a different explanation may account for the pattern.
Negative correlation
A negative correlation occurs when higher values of one variable tend to accompany lower values of another.
Pearson's coefficient is negative.
A negative sign does not mean the relationship is weak or undesirable. It describes direction.
For example, a coefficient of −0.9 represents a stronger linear relationship than a coefficient of +0.4, although the relationships point in opposite directions.
These values illustrate the mathematical interpretation of the coefficient rather than findings from a particular study.
What does a correlation coefficient of zero mean?
A Pearson correlation coefficient of zero indicates no linear correlation.
It does not establish that the variables are unrelated in every possible way.
A curved relationship may exist even when the linear correlation is close to zero.
Imagine a scatterplot where the observations form a U-shaped pattern. The variables may have a clear systematic relationship, but a straight-line summary may fail to capture it.
Outliers can also substantially influence a correlation coefficient.
This is why examining the underlying scatterplot matters alongside reporting a numerical result.
The university-hosted textbook Introduction to Statistics: A Simulation-First Approach, Chapter 19, explains these properties and the limitations of Pearson's correlation coefficient.
Why correlation cannot establish causal direction
Pearson's correlation is mathematically symmetric.
The correlation between X and Y is the same as the correlation between Y and X.
Causation, however, concerns direction.
Saying that X influences Y is different from saying that Y influences X.
Because reversing the variable order does not change Pearson's coefficient, the coefficient cannot independently identify the direction of a causal relationship.
Even a perfect linear correlation cannot overcome that limitation.
Why Correlation Does Not Imply Causation
Correlation does not imply causation because several different processes can generate an observed relationship.
Researchers need to distinguish among these explanations before making causal claims.
1. A third variable may influence both outcomes
A confounding variable is a factor that distorts the apparent relationship between a proposed cause and an outcome.
It may be related to both variables, making the observed association appear to reflect a causal effect that the data do not establish.
A documented example appears in the university statistics textbook discussed earlier.
The example concerns the relationship between the number of firefighters responding to a fire and the amount of damage recorded.
A positive association between the two measures should not be interpreted as evidence that sending more firefighters causes greater damage.
Fire severity offers an alternative explanation.
More severe fires generally require a larger emergency response and can produce greater damage.
The apparent relationship between firefighter numbers and damage therefore needs to be interpreted in light of fire severity.
A simple causal diagram represents the possibility:
X ← Z → Y
Here, X and Y are the observed variables, while Z represents a possible common cause.
The arrows describe a causal hypothesis, not proof that the proposed explanation is correct for a particular dataset.
The important question is whether researchers identified and adequately addressed factors that could distort the relationship.
Not every third variable is a confounder. Its role depends on how it relates to the proposed cause and the outcome.
2. Cause and effect may operate in reverse
Reverse causation occurs when the direction of influence is different from the one assumed.
Consider the tutoring example introduced earlier.
If students receiving additional tutoring have lower examination scores, there are at least two possible interpretations.
One interpretation is that tutoring contributes to lower achievement.
Another is that students who were already experiencing academic difficulties were more likely to receive tutoring.
The second possibility reverses the proposed causal direction.
The observed association cannot distinguish these explanations without additional information.
Researchers would need to examine when the difficulties arose, why students received tutoring, and how comparable students performed under different conditions.
The Harvard-hosted textbook Introduction to Data Science, Chapter 19, discusses reverse causation and related problems in interpreting statistical associations.
The point is not that tutoring is harmful or beneficial. Either conclusion requires appropriate evidence.
3. A relationship may appear because of chance
Not every observed correlation represents a stable relationship in the population.
Random variation can produce apparent patterns, particularly when sample sizes are limited or many potential associations are examined.
Suppose researchers investigate numerous combinations of variables.
Some comparisons may produce statistically notable relationships even when no corresponding underlying association exists.
This does not mean unexpected correlations should be dismissed.
It means researchers should consider uncertainty, the number of analyses performed, and whether independent data support the finding.
A pattern discovered during exploratory research can provide a useful hypothesis for further investigation without establishing that the hypothesis is correct.
4. Selection and measurement may distort an association
The process used to select observations can affect the relationships found in a dataset.
Selection bias occurs when the inclusion of participants or observations distorts the association being investigated.
Measurement bias can arise when variables are recorded inaccurately or inconsistently in ways that affect the comparison.
For example, conclusions based on a selected subgroup may differ from conclusions about the broader population.
Researchers must determine whether the subgroup is appropriate for the question and whether the selection process introduces bias.
Statistical adjustment can help address certain problems, but adding more variables to a model does not automatically make the causal conclusion more reliable.
Some variables are consequences of the proposed cause or are involved in the selection process. Adjusting for them can introduce additional distortion.
The causal role of each variable matters more than the number of variables included in the analysis.
Real-World Example: Berkeley Graduate Admissions
The University of California, Berkeley's 1973 graduate admissions data illustrate how an aggregate statistical relationship can become misleading when important differences between groups are ignored.
The case was examined by P. J. Bickel, E. A. Hammel, and J. W. O'Connell in their 1975 paper, Sex Bias in Graduate Admissions: Data from Berkeley, published in Science.
What the overall figures showed
According to the original study and UC Berkeley's statistics teaching material, the relevant dataset contained 12,763 graduate applications for fall 1973.
The aggregate admission figures were:
|
Applicant category |
Applications |
Admission rate |
|---|---|---|
|
Men |
8,442 |
Approximately 44% |
|
Women |
4,321 |
Approximately 35% |
These figures refer to the historical application categories and do not describe present-day university admissions.
Looking at the totals alone, women had a lower overall admission rate.
That is a valid description of the aggregate data.
However, the difference does not independently establish why the pattern occurred.
What changed when departments were examined?
Applicants were not distributed equally across departments.
Different departments also had substantially different admission rates.
A larger proportion of women applied to departments that were more difficult for applicants to enter.
When UC Berkeley's teaching material examines the six largest departments separately, women have higher admission rates in four departments, while men have higher rates in two.
The interpretation changes because departmental differences help explain the overall pattern.
This is an illustration of Simpson's paradox, in which an association seen in combined data reverses or changes direction when the data are separated into relevant groups.
The example shows why a statistical relationship may depend on how observations are grouped.
What the example teaches—and what it does not
The Berkeley case demonstrates that aggregate data can conceal important differences in the composition of the groups being compared.
It does not establish that every individual admissions decision was unbiased.
Nor does examining departments automatically resolve every question about fairness, selection, qualifications, or institutional processes.
The original researchers examined the historical admissions system within its particular context. Their findings should not be treated as a general conclusion about universities or current admissions practices.
The practical lesson is that a comparison can be mathematically correct yet misleading when relevant differences between groups are omitted.
Before interpreting an overall association, readers should ask whether the observations combine groups with different underlying conditions.
How Do Researchers Establish Causation?
Researchers establish credible causal conclusions by comparing outcomes under conditions that help distinguish the proposed cause from competing explanations.
The central challenge is determining what would have happened without the factor being investigated.
Observational studies
An observational study examines existing exposures, behaviors, characteristics, or outcomes without randomly assigning the relevant conditions.
Such studies can identify patterns and contribute important evidence.
Their difficulty is that the individuals or groups being compared may differ in ways that affect the outcome.
For example, students who choose a particular study method may differ from other students in prior knowledge, available time, motivation, or instructional support.
An observed difference in performance may reflect some combination of these factors.
Researchers can use appropriate comparisons and analytical methods to address confounding, but the credibility of a causal interpretation depends on the study design and its assumptions.
Randomized experiments
A randomized experiment uses a random process to assign participants or other study units to different conditions.
Researchers may compare a group assigned to an intervention with a group assigned to a control condition.
Random assignment helps reduce systematic differences between groups before treatment.
When an experiment is designed and conducted appropriately, differences in outcomes can provide credible evidence about the intervention's causal effect.
Philip B. Stark's UC Berkeley teaching material on treatment effects explains why comparison groups and random assignment are central to experimental causal inference.
However, randomization does not eliminate every research limitation.
Results may be affected by missing data, departures from assigned conditions, measurement problems, small samples, or uncertainty.
Researchers must also distinguish between the effect of being assigned to an intervention and the effect of receiving it.
A credible experiment supports conclusions about the intervention, population, comparison, and outcomes actually studied. Applying those findings to other settings requires further consideration.
Why before-and-after comparisons need caution
Observing improvement after an intervention does not automatically establish that the intervention caused the improvement.
Other factors may change during the same period.
Participants may also have been changing before the intervention began.
A before-and-after comparison can provide useful information, but researchers need to consider whether unrelated changes, selection effects, or other explanations account for the observed difference.
The relevant causal question remains: how would the outcome have differed without the intervention?
Can Observational Studies Support Causal Conclusions?
Yes. Observational studies can contribute to credible causal conclusions when researchers use suitable designs, evaluate alternative explanations, and make defensible assumptions.
Randomized experiments are not feasible or appropriate for every causal question.
Historical and accumulated scientific evidence can also support causal assessment.
An example from the history of public health research
The United States Surgeon General's 1964 report on smoking and health provides a documented example of causal conclusions supported by accumulated research.
According to the Centers for Disease Control and Prevention's historical account, the advisory committee considered more than 7,000 scientific articles available at the time.
The report concluded that cigarette smoking caused lung and laryngeal cancer in men. It described cigarette smoking as a probable cause of lung cancer in women, reflecting the evidence available at that time.
These are historical conclusions rather than a description of the full body of scientific evidence available today.
The example illustrates how investigators can assess causal evidence without deliberately assigning people to harmful exposures.
It is presented as an example of research interpretation, not individual medical guidance.
What strengthens a causal interpretation?
The CDC's Field Epidemiology Manual discusses several considerations relevant to interpreting associations.
These include:
-
Whether the proposed cause came before the outcome.
-
Whether credible investigations produce consistent findings.
-
Whether bias, chance, and confounding have been assessed.
-
Whether the proposed causal explanation is scientifically plausible.
-
Whether patterns across different exposure levels support the interpretation, where applicable.
These considerations are useful, but no single item proves causation.
For instance, an association observed across multiple studies may strengthen confidence. Researchers still need to consider whether those studies share methodological weaknesses.
A plausible mechanism also does not establish that the mechanism caused the particular outcome observed.
The CDC's chapter on analyzing and interpreting data emphasizes assessing chance, selection bias, information bias, and confounding before interpreting an association causally.
The strength of a causal conclusion depends on the combined evidence, not the presence of a single statistical pattern.
Strong Correlation, Statistical Significance, and Prediction
A strong correlation, a statistically significant finding, and an accurate prediction answer different questions from causation.
Confusing these concepts can lead to conclusions that the evidence does not support.
Does a strong correlation prove causation?
No. A strong correlation indicates that variables follow a close statistical pattern, but its strength does not establish why the relationship exists.
For Pearson's correlation coefficient, values close to +1 or −1 indicate strong linear associations.
The relationship may reflect a genuine causal effect. It may also involve a common cause, reverse causation, selection bias, or another process.
Increasing the strength of the correlation does not resolve those possibilities.
Does statistical significance establish causation?
No. Statistical significance concerns evidence evaluated under a statistical model and specified assumptions.
A p-value summarizes how incompatible the observed data are with a stated statistical hypothesis and model.
It is not the probability that the research hypothesis is true.
Nor does a small p-value establish causal direction, rule out bias, or determine whether an observed difference matters in practice.
The American Statistical Association's 2021 statement on statistical significance and replicability emphasizes uncertainty, study quality, multiple comparisons, and reproducibility rather than treating a statistical threshold as sufficient evidence.
A statistically significant association may still have an uncertain causal explanation.
Why prediction is not the same as causation
Prediction asks whether information about one variable helps estimate another.
Causal analysis asks what would happen if a factor were changed.
A variable can be useful for prediction without causing the outcome.
For example, a measurement may act as an indicator of an underlying process. Knowing its value may help forecast the outcome even though changing the measurement itself would not change what happens.
This distinction becomes important when statistical findings are used to recommend interventions.
A predictor is not automatically an effective target for change.
How to Evaluate a Causal Claim
Evaluating a causal claim begins by identifying what researchers observed and what the proposed explanation adds to that observation.
Readers do not need advanced statistical training to recognize several important warning signs.
1. Identify the exact claim
Separate the observed relationship from the causal conclusion.
Ask which variable is presented as the cause, which outcome is affected, and whether the claim describes observation or intervention.
For example, the statement that two variables are associated is narrower than the statement that changing one will change the other.
The distinction should remain clear before examining the rest of the evidence.
2. Find the original evidence
Determine whether the claim comes from a graph, survey, observational study, randomized experiment, or synthesis of multiple studies.
These sources can support different conclusions.
Check whether the original report describes its methods and whether summaries accurately reflect the findings.
For a broader research-appraisal process, see Collegenp's guide on how to evaluate research claims and recognize overstatements.
3. Check which event came first
A proposed cause must precede the outcome it is claimed to influence.
If the outcome existed before the proposed cause, the suggested causal direction needs reconsideration.
However, timing alone cannot establish causation.
Other relevant changes may have occurred between the proposed cause and the observed outcome.
The sequence of events is necessary to examine, but it is not a substitute for a credible comparison.
4. Consider alternative explanations
Ask what else might explain the relationship.
Relevant possibilities include confounding variables, reverse causation, selection bias, measurement problems, and random variation.
The aim is not to invent an alternative explanation and assume it is correct.
It is to determine whether the research adequately investigated plausible alternatives.
An unresolved explanation may weaken the causal conclusion even when the observed association is clear.
5. Examine the comparison groups
Identify what researchers compared and whether the comparison is appropriate.
For an experiment, check whether participants were randomly assigned and whether the intended conditions were maintained.
For observational research, examine whether relevant differences between groups were considered.
The Berkeley admissions case demonstrates why the composition of comparison groups can substantially affect interpretation.
6. Look beyond the headline statistic
A single coefficient or p-value rarely provides enough information to evaluate a causal claim.
Consider the quality of measurements, sample size, uncertainty, unusual observations, and possible selective reporting.
For a correlation, examine whether the reported coefficient accurately represents the pattern.
For an estimated intervention effect, consider both uncertainty and the size of the reported difference.
A statistically detectable relationship may not be practically important.
7. Examine independent supporting evidence
Consider whether credible investigations using relevant methods support the interpretation.
Independent evidence can help identify whether an observed relationship is stable and whether competing explanations have been addressed.
Agreement is more informative when the studies offer genuinely different sources of evidence rather than repeating the same limitations.
Conflicting results also deserve examination, particularly when studies investigate different populations, conditions, or outcomes.
8. Match the conclusion to the evidence
The final statement should reflect what the research can support.
If an observational study identifies an association but cannot adequately distinguish among causal explanations, describe the finding as an association.
If a credible experimental or observational causal design supports an effect, identify the relevant intervention or exposure, outcome, population, and conditions.
When essential methodological information is unavailable, the causal claim remains uncertain.
This is more accurate than treating every association as proof of causation or dismissing observational evidence as meaningless.
How to Describe Research Findings Accurately
Accurate wording helps readers distinguish reported observations from causal interpretations.
Different research designs justify different levels of confidence.
|
Evidence available |
Appropriate wording |
|---|---|
|
Observational association |
"X was associated with Y in the observed sample." |
|
Unresolved confounding |
"Other factors may explain some or all of the relationship." |
|
Insufficient methodological detail |
"The available information is insufficient to evaluate causation." |
|
Credible randomized experiment |
"Assignment to X affected the measured outcome compared with the control condition." |
|
Strong supporting causal evidence |
"The evidence supports a causal relationship under the conditions investigated." |
These examples are guidance for communicating evidence, not fixed wording required for every research report.
The population and setting matter.
A finding involving students at a particular institution, for example, does not automatically apply to students in different educational systems.
Similarly, a causal effect observed over a defined period does not independently establish that the same effect will persist over a longer period.
Why headlines require particular care
A headline may omit research limitations that appear in the full study.
Words such as "causes," "prevents," or "improves" express stronger claims than "is associated with" or "was linked to."
The appropriate wording depends on the evidence supporting the relationship, not merely the terminology used by the original author.
Before repeating a headline's conclusion, check whether the research examined a causal effect or reported an association.
Collegenp's article on checking claims before sharing them provides further guidance on tracing claims to their sources.
Common Misconceptions About Correlation and Causation
Several misunderstandings arise when readers interpret statistical relationships without considering how the data were produced.
Every correlation has a hidden third-variable explanation
Not necessarily.
Some correlations reflect genuine causal relationships.
Others result from shared causes, reverse causation, selection effects, chance, or combinations of these processes.
Identifying a possible third variable does not prove that it explains the association.
The proposed explanation must also be investigated.
If one event happens before another, it must be the cause
The sequence of events matters, but it is not sufficient evidence of causation.
An outcome may occur after an exposure because of another process or changes that were already underway.
Researchers need a defensible explanation of what would have happened without the proposed cause.
Adjusting for more variables makes causal estimates more accurate
Not automatically.
Appropriate adjustment can help address confounding.
However, adjusting for variables affected by the proposed cause or involved in selection can distort the relationship.
Researchers need to understand the causal roles of the variables they include.
A larger statistical model is not necessarily a more credible causal model.
Correlation is useless without causation
Correlation remains useful for describing patterns, assessing associations, making predictions, and developing research questions.
Its limitations concern causal interpretation.
A relationship can be informative even when researchers cannot establish that changing one variable would change the other.
A randomized experiment settles every causal question
Random assignment can provide strong causal evidence, but the interpretation still depends on how the experiment was conducted.
Missing observations, noncompliance, measurement quality, uncertainty, and the characteristics of participants may affect conclusions.
A study can provide credible evidence for a particular intervention without establishing that the effect applies in every setting.
Conclusion
Correlation describes a relationship between variables. Causation concerns whether one factor influences another outcome.
The distinction is not simply about whether a statistical relationship is strong or weak.
A convincing causal explanation must account for how the evidence was produced, whether the proposed cause preceded the outcome, how the comparison was constructed, and whether credible alternative explanations have been addressed.
Correlation can reveal meaningful patterns and support prediction. It cannot, by itself, establish causal direction.
Randomized experiments and carefully designed observational investigations can provide stronger evidence, although their conclusions remain subject to methodological assumptions and practical limitations.
When assessing a research finding, the most useful question is whether the available evidence supports the causal statement being made—or whether the defensible conclusion is narrower.
Sources and References
1. Introduction to Statistics: A Simulation-First Approach. Chapter 19, "Correlation." University-hosted statistics textbook.
2. Irizarry, Rafael A. Introduction to Data Science. Chapter 19, "Association Is Not Causation." Harvard-hosted educational text.
3. Stark, Philip B. Does Treatment Have an Effect? University of California, Berkeley, Department of Statistics.
4. Bickel, P. J., Hammel, E. A., and O'Connell, J. W. (1975). "Sex Bias in Graduate Admissions: Data from Berkeley." Science, 187(4175), 398–404. DOI: 10.1126/science.187.4175.398.
5. Barocas, Solon; Hardt, Moritz; and Narayanan, Arvind. Fairness and Machine Learning. Chapter 5, "Causality."
6. Dicker, Richard C. Analyzing and Interpreting Data. Chapter 8, The CDC Field Epidemiology Manual. Centers for Disease Control and Prevention, 2025 web edition.
7. Centers for Disease Control and Prevention. A History of the Surgeon General's Reports on Smoking and Health. Historical account of the 1964 Surgeon General's report.
8. American Statistical Association President's Task Force. (2021). Statement on Statistical Significance and Replicability. Published in Amstat News.






Comments 0
No comments yet. Be the first to start the conversation.