



An Air Quality Index (AQI) reading tells you how polluted the outdoor air is and what that pollution may mean for your health. It can help you decide whether conditions are suitable for outdoor exercise, school activities, commuting, or prolonged time outside.
The basic principle is straightforward: within the same AQI system, higher numbers indicate greater pollution-related health concerns.
But an AQI reading is not meaningful without context. A value of 100 does not necessarily have the same classification in every country. Two air-quality apps may display different numbers for the same city, and a favorable reading does not establish that the air is free from harmful pollutants.
Understanding the index system, dominant pollutant, reporting period, and monitoring location makes the information more useful.
Answer Summary: An Air Quality Index converts measurements of outdoor air pollutants into a number, category, and often a color indicating potential health concerns. Under the U.S. Environmental Protection Agency (EPA) system, readings of 0–50 are Good, 51–100 are Moderate, and values above 100 indicate increasing concern, beginning with sensitive groups. Because countries use different AQI systems, readers should check the reporting scale, pollutant, measurement time, and official health guidance before interpreting a reading.
Key Takeaways:
-
AQI describes outdoor pollution and associated health concerns.
-
Higher AQI values indicate worsening conditions within the same reporting system.
-
National and regional AQI scales are not directly interchangeable.
-
The dominant pollutant and reporting period affect interpretation.
-
Sensitive groups may need precautions at lower pollution levels.
-
AQI does not directly measure personal exposure or long-term air quality.
What Does an AQI Reading Actually Measure?
An Air Quality Index is a reporting system that translates concentrations of selected outdoor air pollutants into a simplified indicator of air quality.
Air-quality monitoring equipment measures pollutants in physical units. These measurements are compared with concentration thresholds established by the relevant reporting authority.
The resulting index communicates potential health concerns through categories rather than requiring readers to interpret multiple technical measurements.
The U.S. EPA reports AQI information for five major pollutant groups:
-
Particulate matter, including PM2.5 and PM10
-
Ground-level ozone (O₃)
-
Nitrogen dioxide (NO₂)
-
Sulfur dioxide (SO₂)
-
Carbon monoxide (CO)
How the AQI number is determined
In the U.S. system, each relevant pollutant concentration is converted into a corresponding AQI value using pollutant-specific breakpoints.
The highest applicable pollutant index determines the overall reported AQI for the pollutants included in that calculation.
For example, if particle pollution produces a higher AQI than ozone, particle pollution determines the overall reading.
This does not mean particle pollution has the highest physical concentration. Different pollutants use different measurement units and concentration thresholds.
An AQI is also not a percentage.
A reading of 80 does not mean that outdoor air is 80% clean. Similarly, an AQI of 160 does not establish that pollution concentrations are exactly twice those at AQI 80.
These figures represent positions on an index constructed to communicate pollution-related health concerns.
What Do AQI Numbers and Colors Mean?
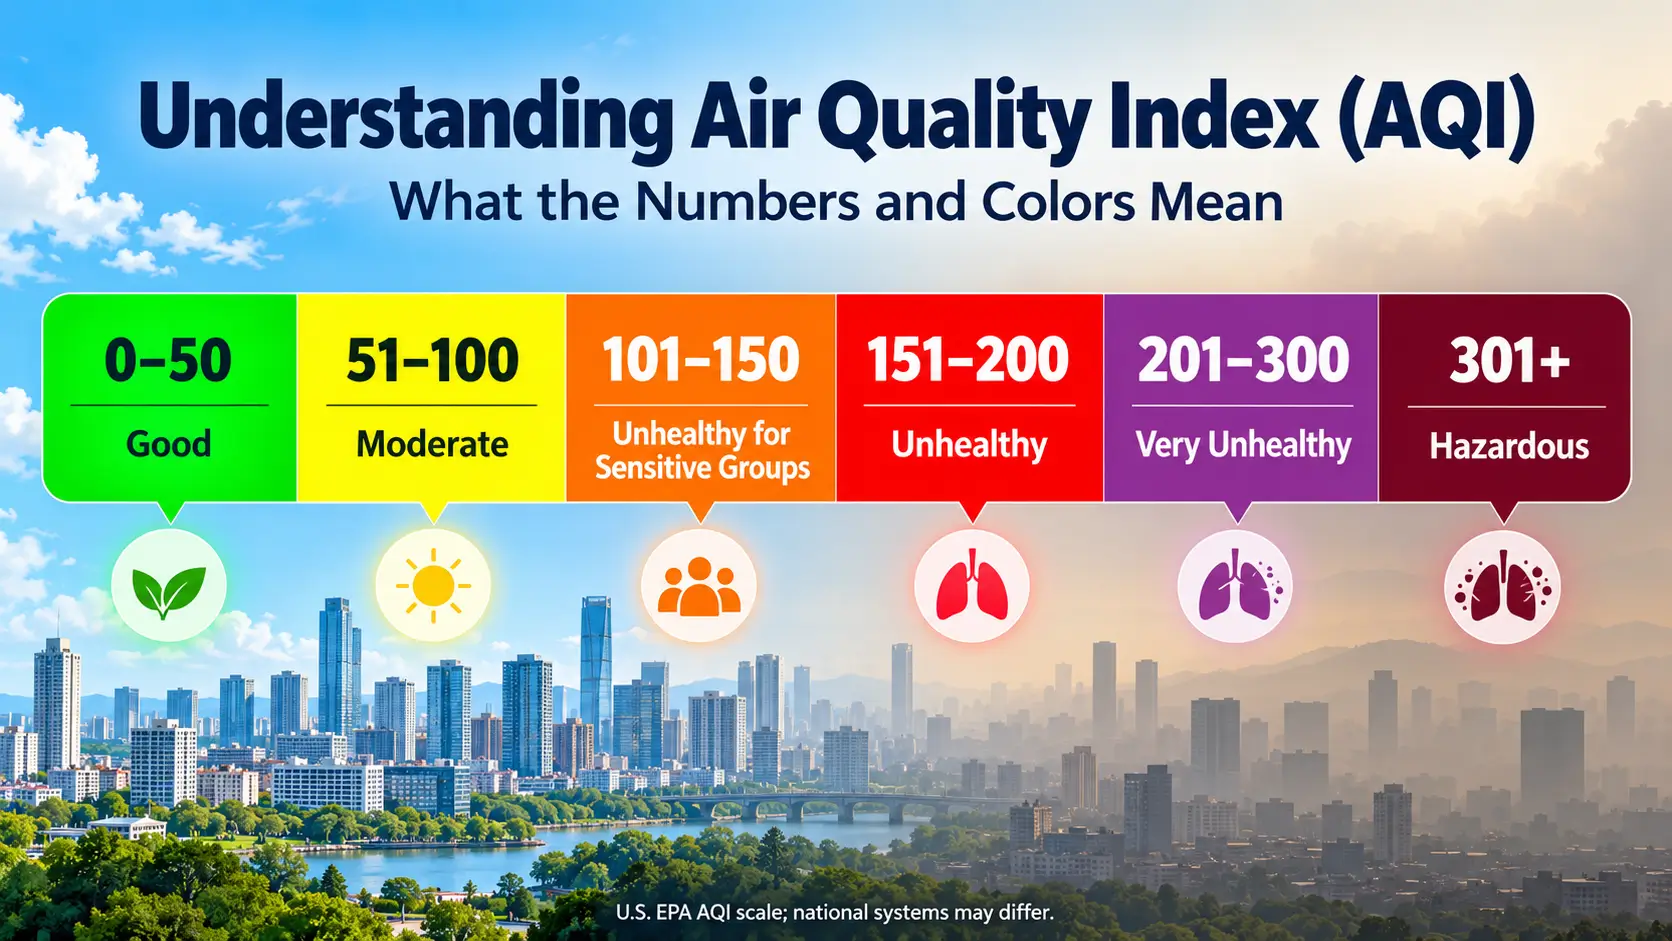
Under the U.S. EPA system, AQI readings are divided into six categories. Each category represents an increasing level of pollution-related health concern.
|
U.S. AQI |
Color and category |
Health interpretation |
|---|---|---|
|
0–50 |
Green — Good |
Air quality is satisfactory, with little or no pollution-related risk indicated. |
|
51–100 |
Yellow — Moderate |
Acceptable for most people, although unusually sensitive individuals may be affected. |
|
101–150 |
Orange — Unhealthy for Sensitive Groups |
People susceptible to the relevant pollutant may experience health effects. |
|
151–200 |
Red — Unhealthy |
Some members of the general public may experience effects; sensitive groups face greater concern. |
|
201–300 |
Purple — Very Unhealthy |
A health alert indicating increased concern for everyone. |
|
301 and above |
Maroon — Hazardous |
Emergency-level health warning, with a greater likelihood of effects across the population. |
These categories follow the EPA's official AQI definitions.
Why the category boundaries matter
The number at which one category ends and another begins can affect how an app presents health guidance.
Under the U.S. system, AQI 100 remains Moderate, while 101 enters Unhealthy for Sensitive Groups. Likewise, 150 is within the orange category, while 151 begins the red Unhealthy category.
These boundaries are reporting classifications, not exact biological thresholds.
Individual health responses depend on the pollutant, exposure duration, physical activity, and personal susceptibility.
A reading near a category boundary should therefore be interpreted alongside the relevant health guidance rather than treated as an absolute dividing line between safe and unsafe air.
Why AQI Scales Differ Around the World
There is no single internationally standardized AQI calculation and classification system.
Countries and regional authorities use different pollutant thresholds, reporting categories, averaging methods, and public-health frameworks.
Major international AQI systems
The United States uses the EPA AQI, with six categories ranging from Good to Hazardous.
India's National Air Quality Index also has six categories, but its classifications differ:
-
Good: 0–50
-
Satisfactory: 51–100
-
Moderately Polluted: 101–200
-
Poor: 201–300
-
Very Poor: 301–400
-
Severe: 401–500
India's index also includes pollutants such as ammonia and lead, which are not part of the five major pollutant groups reported through the U.S. AQI framework.
The United Kingdom uses the Daily Air Quality Index (DAQI), a scale from 1 to 10:
-
Low: 1–3
-
Moderate: 4–6
-
High: 7–9
-
Very High: 10
Canada uses the Air Quality Health Index (AQHI), which communicates health risk on a 1–10+ scale, ranging from Low Risk to Very High Risk.
The European Environment Agency (EEA) uses six descriptive categories: Good, Fair, Moderate, Poor, Very Poor, and Extremely Poor. Its index uses pollutant concentration bands rather than the U.S. numerical AQI categories.
These systems should be interpreted using their respective authorities' published definitions.
Why AQI 200 can mean different things
Consider a hypothetical reading of AQI 200.
Under the U.S. EPA system, this falls within the Unhealthy category.
Under India's national system, 200 is the upper boundary of Moderately Polluted.
The numerical value is identical, but the official category differs.
This does not establish that the underlying pollution concentrations are the same. It demonstrates that the reporting frameworks use different thresholds.
When traveling, comparing international air-quality reports, or using an unfamiliar application, identify the index system before interpreting its numbers.
How Do Pollutants Affect an AQI Reading?
The pollutant responsible for an AQI reading matters because different pollutants have different properties and health implications.
PM2.5 and PM10
Particulate matter consists of tiny solid particles and liquid droplets suspended in air.
PM2.5 refers to fine particles with aerodynamic diameters of 2.5 micrometers or smaller. PM10 refers to inhalable particles with diameters of 10 micrometers or smaller.
PM10 includes the finer PM2.5 fraction.
Particle pollution can arise from combustion, smoke, dust, and other natural or human-related sources.
Fine particles can enter deeply into the respiratory system, making particulate pollution an important concern for people with heart or lung conditions and other susceptible groups.
For background information about pollutant origins, see Composition of Air and Sources of Air Pollution.
Ground-level ozone and other gases
Ground-level ozone is a pollutant associated with respiratory health concerns, particularly during outdoor physical activity.
Nitrogen dioxide, sulfur dioxide, and carbon monoxide are other pollutants covered by major air-quality reporting systems.
The main pollutant can vary by location and time. Consequently, two readings with similar overall AQI values may reflect different pollutant conditions.
Knowing the pollutant helps readers understand which health guidance is most relevant.
AQI versus pollutant concentration
AQI and pollutant concentration are not interchangeable.
A PM2.5 concentration is commonly expressed in micrograms per cubic meter (µg/m³), while an AQI is a unitless index value.
For example:
-
PM2.5 at 20 µg/m³ describes a pollutant concentration.
-
AQI 20 describes a position on a particular air-quality index.
Converting concentration into AQI requires the relevant pollutant breakpoints and averaging period.
The differences between national systems are substantial.
Under the EPA's 24-hour PM2.5 breakpoint table, the Moderate category extends from 9.1 to 35.4 µg/m³.
Under India's national AQI system, the Satisfactory category corresponds to 24-hour PM2.5 concentrations of 31–60 µg/m³.
These figures illustrate why pollutant concentration and AQI classification should not be confused.
The EPA revised its PM2.5 AQI breakpoints in 2024. Older conversion tables may therefore assign different classifications to certain concentrations.
How to Interpret Current, Daily, and Forecast AQI Readings
An AQI reading should be interpreted alongside its reporting period. Current conditions, daily averages, and forecasts answer different questions.
Daily AQI
A daily AQI summarizes pollution conditions using pollutant-specific averaging periods.
Under the U.S. EPA framework, particle-pollution AQI calculations generally use 24-hour concentrations, while ozone AQI calculations generally use 8-hour concentrations.
A completed daily reading therefore represents an averaging period rather than air quality at one particular moment.
Current AQI and NowCast
AirNow uses a method called NowCast for its current ozone and particle-pollution reporting.
NowCast incorporates multiple hours of monitoring information. During relatively stable conditions, it uses longer averaging periods. When pollution changes rapidly, it gives greater emphasis to more recent conditions.
This helps readers understand current conditions without relying entirely on an isolated hourly measurement.
However, a NowCast value is not an instantaneous pollution measurement.
Forecast AQI
An AQI forecast predicts future pollution conditions.
In the U.S. system, a particle-pollution forecast generally concerns the next day's average 24-hour concentration. Ozone forecasts typically focus on the highest expected 8-hour average.
Forecasts can inform plans for outdoor activities, but actual conditions may differ.
If an app displays tomorrow's forecast while another shows the latest measured conditions, their numbers should not be treated as equivalent observations.
Why the measurement location matters
Air pollution can vary across neighborhoods and within cities.
A monitoring station may not represent the exact conditions at a school, roadside location, workplace, or home.
The European AQI, for example, displays both monitoring-station information and modeled estimates. Its mapped values can therefore represent different forms of air-quality information.
A model provides an estimate based on available information and calculations; a monitoring station measures conditions at its location.
When examining a reading, check whether the information refers to a particular station, regional area, or modeled location.
Also check the timestamp. An older measurement may be less useful when conditions are changing quickly.
How Should AQI Affect Outdoor Activities?
AQI can help readers decide whether to adjust outdoor activity, particularly when exercise involves prolonged or heavy physical exertion.
The appropriate response depends on the reporting system, pollutant, individual susceptibility, and activity intensity.
General activity guidance under the U.S. AQI
The U.S. Centers for Disease Control and Prevention (CDC) provides the following guidance, summarized here for general readers:
-
Good (0–50): Ordinary outdoor activities are generally appropriate.
-
Moderate (51–100): Most people can continue usual activities. Unusually sensitive individuals should consider reducing prolonged or heavy exertion, particularly if symptoms occur.
-
Unhealthy for Sensitive Groups (101–150): Sensitive groups should reduce prolonged or heavy exertion, take more breaks, and consider less intense activities.
-
Unhealthy (151–200): Sensitive groups should avoid prolonged or heavy exertion. Other people should reduce prolonged or heavy exertion.
-
Very Unhealthy (201–300): Sensitive groups should avoid outdoor physical activity. Other people should avoid prolonged or heavy exertion.
-
Hazardous (301 and above): Everyone should avoid outdoor physical activity and follow local public-health guidance.
These recommendations apply to the U.S. reporting system and should not automatically be transferred to other national AQI scales.
Who is more susceptible to air pollution?
Sensitive groups vary somewhat by pollutant.
For particle pollution, groups requiring particular attention include children, older adults, and people with heart or lung conditions.
For ozone, people with lung disease and those active outdoors, including children, may be more susceptible.
This distinction matters for school sports, outdoor work, and exercise planning.
A short period outdoors and an extended session of vigorous exercise do not necessarily involve the same exposure.
Someone with an existing respiratory condition should also follow their healthcare professional's individualized guidance rather than rely exclusively on an app's general category.
How duration and activity intensity affect exposure
During strenuous activity, breathing usually becomes deeper and faster, increasing the volume of air inhaled.
When air quality deteriorates, reducing activity intensity or time outdoors can help limit pollution exposure.
Depending on circumstances and official guidance, adjustments may include shorter outdoor sessions, additional breaks, moving vigorous activity indoors, or rescheduling it.
The most appropriate action is not determined by the AQI number in isolation.
It also depends on the pollutant, whether conditions are improving or worsening, and the health needs of the people involved.
This is general public-health information, not individualized medical advice.
Why Do Different Air-Quality Apps Show Different AQI Readings?
Two applications may display different values for the same city because they do not necessarily use identical sources or calculations.
Common explanations include differences in:
-
Index systems: One app may use U.S. AQI while another uses a national system.
-
Reporting periods: One may show a recent reading while another displays a longer-term average or forecast.
-
Monitoring locations: Services may rely on different stations or geographic areas.
-
Pollutant coverage: Some reports include different pollutants or lack measurements for particular pollutants.
-
Calculation methods: One provider may use measured concentrations, another may use modeled estimates, or a service may combine both.
The EEA's European AQI illustrates the importance of these distinctions. Its platform provides station-based and modeled information and identifies cases where pollutant data are incomplete or estimated.
Different readings therefore do not automatically indicate that one provider is inaccurate.
How to compare conflicting readings
First, check whether both applications use the same AQI scale.
Next, compare their measurement times, reporting locations, and dominant pollutants.
If the methods differ, numerical agreement should not be expected.
For health-related planning, the relevant official local monitoring service is a useful reference. Additional readings can provide context, particularly where official station coverage is limited.
A missing value should also be interpreted carefully. No Data means the service lacks sufficient information for that result; it does not mean the air is clean.
What Can an AQI Reading Not Tell You?
An AQI is a useful indicator, but it cannot provide a complete assessment of air quality or personal health risk.
It does not directly measure personal exposure
An AQI generally represents outdoor conditions at a monitoring location or across a reporting area.
It does not directly measure how much pollution a particular person inhales.
Actual exposure depends on factors such as time spent outdoors, activity intensity, nearby pollution sources, and indoor conditions.
It does not measure every airborne pollutant
The pollutants covered depend on the reporting system.
The U.S. AQI, for example, does not include pollen counts.
A person with seasonal allergies may experience symptoms even when the AQI is Good.
Outdoor AQI readings also do not directly measure indoor pollution.
It does not establish long-term air quality
Short-term readings and annual pollution exposure address different questions.
The European Environment Agency explicitly distinguishes its short-term air-quality index from annual air-quality assessments and cautions against using its index to determine legal compliance with air-quality standards.
A favorable AQI reading on one day does not establish that a location has consistently low pollution throughout the year.
It does not guarantee an absence of health risk
Good or Moderate classifications describe pollution relative to the thresholds of a particular index.
They do not establish that every person will remain unaffected.
Individual susceptibility varies, and pollutants not represented in the index can still be present.
How to Read an AQI Display Accurately
Before using an AQI reading to make an outdoor activity decision, check the following information:
-
Reporting system: Identify the country or provider's AQI scale.
-
Numerical category: Interpret the reading using the correct official category boundaries.
-
Dominant pollutant: Check whether PM2.5, ozone, or another pollutant is responsible for the reported level.
-
Measurement time: Distinguish current conditions from daily averages and forecasts.
-
Location and source: Identify the monitoring station, geographic area, or modeled estimate.
-
Health guidance: Consider the category, activity duration, intensity, and individual susceptibility.
These checks help avoid common mistakes, particularly when comparing international readings or interpreting conflicting information from different applications.
Conclusion
Understanding an Air Quality Index reading requires more than recognizing a color or numerical category.
The reporting system establishes what the number means. The dominant pollutant, averaging period, monitoring location, and individual health circumstances determine how useful that information is for a particular decision.
For everyday use, the sound approach is to identify the applicable local AQI scale, check the latest relevant reading, and follow the corresponding health guidance.
AQI is an indicator of outdoor pollution rather than a complete assessment of personal exposure or long-term air quality. Interpreting it within those limits helps readers make informed decisions about outdoor activities without placing unwarranted confidence in a single number.
References
1. U.S. Environmental Protection Agency / AirNow. Air Quality Index Basics. Official U.S. AQI categories, pollutants, colors, and health interpretations.
2. U.S. Environmental Protection Agency / AirNow. Using the Air Quality Index. Explanation of daily AQI, forecasts, averaging periods, and NowCast calculations.
3. U.S. Environmental Protection Agency. AQI Breakpoints. Official pollutant concentration thresholds. Reference table dated October 29, 2026.
4. Government of India, Indian Economic Service. National Air Quality Index. Indian AQI categories, pollutant thresholds, and health classifications.
5. UK Department for Environment, Food and Rural Affairs. Using the Daily Air Quality Index. Updated April 13, 2026. UK DAQI categories and pollutant coverage.
6. European Environment Agency. European Air Quality Index. European index methodology, monitoring sources, categories, and limitations.
7. Government of Canada. About the Air Quality Health Index. Canadian AQHI scale, risk categories, and public-health guidance.
8. U.S. Centers for Disease Control and Prevention. How to Use the HeatRisk Tool and Air Quality Index. September 18, 2025. U.S. AQI health precautions, susceptible groups, and interpretation guidance.






Comments 0
No comments yet. Be the first to start the conversation.