

How to Teach Map Skills in Geography
Maps help students make sense of place, distance, and pattern. Strong map skills turn a flat page or screen into a tool for inquiry. This guide brings together proven teaching practices, age-appropriate progressions, and classroom-ready activities.
It draws on research in geography education and cognitive science, so lessons feel practical and stick over time. In short: teach one clear idea at a time, give students plenty of low-stakes practice, and anchor learning in real maps and real questions.
Learners still need this support. In the most recent U.S. grade-8 geography assessment (2018), only about a quarter met the Proficient benchmark, which signals gaps in independent map use and reasoning.
Table of Content
- How to Teach Map Skills in Geography
- What “Spatial Thinking” Covers
- Learning Progression You Can Use
- Teaching Principles That Raise Retention
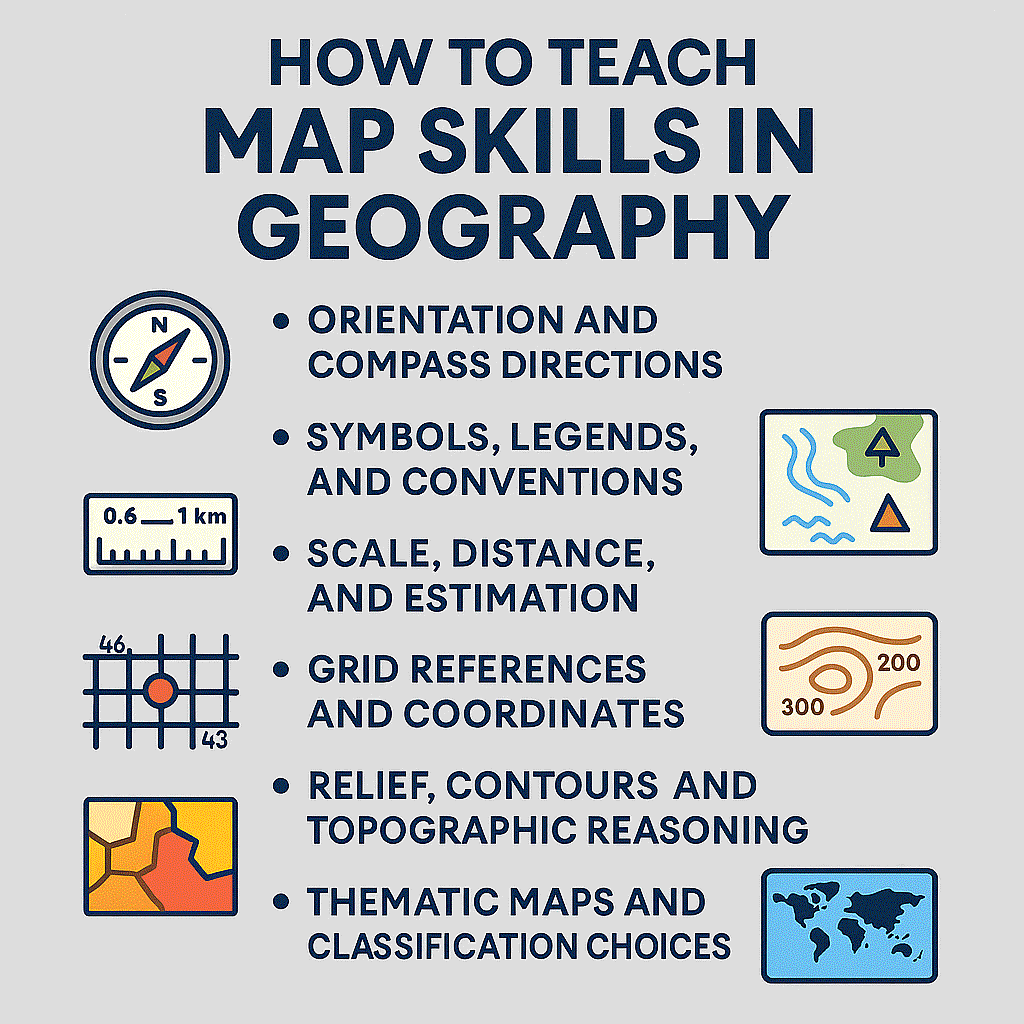
- Core Strands for Teaching Map Skills
- Fieldwork That Feeds Map Learning
- Digital Mapping and GIS: Start Small, Keep Purpose Clear
- Assessment That Guides Teaching
- Common Misconceptions (and how to fix each one)
- Differentiation That Keeps Everyone Moving
- Daily and Weekly Routines That Stick
- Practical Activities You Can Lift and Use
- Ethics and Source Quality in Map Use
- Why This Mix Works (and lasts)
- FAQ-Ready Misconception Fixes
- Conclusion
- FAQs
What “Spatial Thinking” Covers
Spatial thinking blends three parts: concepts of space (location, distance, direction, region), tools of representation (maps, diagrams, GIS), and processes of reasoning (comparing, inferring, predicting). This model comes from the National Research Council and fits map teaching well, since each lesson can target one part and then connect the set.
A standards lens adds clarity. Geography for Life (2012) organizes 18 standards by grade bands (4, 8, 12), which helps departments sequence map reading, grid references, contours, projections, and geospatial technologies across years.
Learning Progression You Can Use
Primary (ages 7–11)
-
Compass points and simple bearings
-
Symbols and legends for common features
-
Bar scales before ratios
-
Four-figure grid references
-
Sketch maps of classroom, school grounds, and the route home
The Royal Geographical Society (RGS) publishes year-by-year map-skills lessons with ready plans and tasks, which makes it easy to spiral skills each year and avoid big jumps.
Lower Secondary (ages 11–14)
-
Six-figure grid references and accuracy checks
-
Latitude and longitude with simple conversion tasks
-
Contour lines, slope, and cross-sections
-
Thematic mapping: choropleth, proportional symbols
-
First steps in web mapping and simple overlays
RGS lessons for years four to six introduce OS map conventions, grid references, and contour models—helpful even for older learners who need a reset.
Upper Secondary (14–16+)
-
Projection trade-offs and map bias
-
Classification choices in choropleths
-
GIS queries, buffers, and simple analysis
-
Fieldwork data from collection to map product
-
Source critique: scale choice, symbolization, and uncertainty
Inspection evidence from England points to the value of coherent sequences, explicit teaching of map conventions, and regular fieldwork, with gaps where time and staff capacity are tight. Use those findings to plan staged improvement rather than one-off fixes.
Teaching Principles That Raise Retention
Work with cognitive load, not against it
Map tasks can pack in symbols, color, grids, and numbers. Start small. Strip displays to what matters. Teach with worked examples, then move to guided practice before independence. This approach comes from cognitive load theory and is well supported by classroom reviews.
Use words and visuals together (dual coding)
Say less, point more. Label directly on the map where possible. Pair a short explanation with a clean diagram, animation, or tracing. This verbal-visual pairing helps memory.
Build long-term memory with retrieval and spacing
Open with a three-question warm-up, mix old and new content weekly, and keep quizzes low-stakes. Evidence summaries show that retrieval and spacing support durable learning.
Treat spatial skill as trainable
A large meta-analysis across 217 studies reported an average training effect around g ≈ 0.47, with gains that lasted and transferred to new tasks. Short, frequent drills make sense in geography classes.
Core Strands for Teaching Map Skills
Orientation and Compass Directions
Start indoors with a simple floor compass taped on the classroom tiles. Add bearings after the points feel secure. Use short prompts: “From the lab, in which direction is the library?” Keep feedback immediate.
Quick task (10 min):
Students follow a six-step route on the playground using bearings. Pairs check each other’s paths.
Symbols, Legends, and Conventions
Teach the map “hygiene” that many learners skip: title, north arrow, legend, scale, source. Keep legends compact and consistent across tasks to reduce clutter. Use a symbol bingo from RGS or OS to turn recall into a quick game.
Class tip:
Ask students to write two sentences under every finished map: “What this map shows” and “What this map cannot show.” That line on limits builds healthy skepticism early.
Scale, Distance, and Estimation
Bar scales come first. Ratio scales come later. Begin with straight lines, then move to routes using string or a strip of paper along paths. Ask for an estimate before measuring, so students learn to sense order of magnitude.
Class task:
“Fastest safe route” between two points, with constraints like bridges only or avoiding steep slopes. Students justify choices using the scale bar and symbols they select.
Grid References and Coordinates
Use the mnemonic “along the corridor, up the stairs” for eastings then northings. Move from four-figure to six-figure once accuracy is stable. Ordnance Survey Mapzone has short, age-friendly practice for this exact skill.
Accuracy check:
Swap papers and verify a partner’s 6-figure points with a transparent grid.
Relief, Contours, and Topographic Reasoning
Contours need concrete links. Build a cardboard hill with layers at set intervals, then draw the matching contour map. Move from model to cross-section and back. The USGS library has ready classroom tasks you can print or adapt.
Decision task:
“Which route climbs less?” Students compare two lines across a topographic tile and defend their choice using contour spacing and interval math.
Thematic Maps and Classification Choices
Show how equal intervals differ from quantiles. Ask students to try both and discuss how the story changes. This builds numeracy and honesty in presentation.
Mini-project: Map school travel modes (walk, bike, bus). Groups choose a classification, design a legend, and add a short note on limitations.
Projections and Distortion
All flat maps trade off shape, area, distance, or direction. A simple orange-peel demo helps students grasp why. National Geographic’s activity walks through hands-on steps and comparison across designs.
Debate prompt:
“When is Mercator acceptable, and when does it mislead?” Students argue from use-case rather than preference, then cite an example map that fits their claim.
Fieldwork That Feeds Map Learning
Fieldwork doesn’t need a coach bus. A 400–600 meter transect near the school can power a week of map lessons. Sample tasks:
-
Land-use tallies at four points
-
Traffic counts at one junction
-
Micro-climate spots: shade, surface type, wind exposure
-
Photos with simple geotags
Back in class, students draw a sketch map, align it to a base map, and turn data into a small thematic product. RGS guidance explains how short, frequent fieldwork builds place knowledge and spatial thinking. Recent coverage has highlighted reduced fieldwork time in some schools, so local and low-cost designs help keep access broad.
Digital Mapping and GIS: Start Small, Keep Purpose Clear
Web maps and entry-level GIS help students ask questions, add layers, and share findings. The key is focus: one map question, one or two tools, one short product.
Three easy wins
-
Plot home–school journeys and check road safety points.
-
Overlay flood zones with housing age to talk risk.
-
Build a simple story map (photos + captions + route line) for a local trail.
A 2023 meta-analysis found geospatial technologies had a medium positive effect on learning outcomes, with stronger gains in cognitive measures than in non-cognitive ones. Moderator factors included intervention length and education level. Plan small cycles, then scale.
For younger learners, OS Mapzone keeps practice friendly and short.
Assessment That Guides Teaching
Formative checks that take minutes
-
Do-now: three micro-prompts (symbol, grid, distance).
-
Hinge question: one multiple-choice item that pinpoints a misconception (for example, reading northings first).
-
Exit ticket: one application line (e.g., “Which route is safer, and why?”).
Evidence reviews from the Education Endowment Foundation support these cognitive science moves—retrieval, spacing, interleaving—when tied to clear next steps in teaching.
Performance tasks with a simple rubric
Use three strands across all map products:
-
Accuracy: correct grid or lat/long, scale use, symbol choice
-
Reasoning: clear link from map evidence to claim
-
Communication: clean legend, labels, and a short “limitations” note
For stimulus ideas and item style, browse the NAEP geography pages and released items, which show how map skills appear in national assessments.
Common Misconceptions (and how to fix each one)
-
“North is always up.” Rotate maps in tasks. Ask students to orient using ground clues or a compass rose placed at an angle.
-
“Eastings and northings are interchangeable.” Repeat the routine phrase “along, then up” and check with peer marking on overlays from OS.
-
“Contours are lines on flat land.” Go back to the model, then to the cross-section. USGS classroom resources include clean examples that match classroom builds.
-
“Mercator is wrong in all cases.” Reframe with purpose: navigation vs. area comparison. Use the NG activity to compare distortion and pick a projection for a stated task.
Differentiation That Keeps Everyone Moving
-
For multilingual learners: preteach 8–10 core terms with image-word cards; provide sentence frames such as “The distance from A to B is ___ using the ___ scale.” Pair talk before whole-class talk.
-
For students who need more structure: layer steps, reduce clutter on map extracts, and keep intervals visible on every contour task. These moves align with cognitive load guidance.
-
For high-readiness students: compare quantiles vs. equal intervals on the same dataset; test a second projection; write a short critique of a public map’s legend.
Daily and Weekly Routines That Stick
-
Daily warm-up (3–5 min): symbol → grid → distance
-
Mini-lesson (10–12 min): one idea; one worked example
-
Guided practice (10 min): pairs solve two items; teacher circulates
-
Independent task (15–20 min): short product with a clear success statement
-
Exit (3 min): one question to check readiness for the next step
This flow keeps cognitive demand steady and gives frequent feedback loops. It also leaves time for small wins students can see, which supports motivation.
Practical Activities You Can Lift and Use
Compass Carousel
Four stations on the sports ground. At each, a card lists a starting point and a bearing. Students walk the line, mark the destination on a photocopied map, and write one clear step: “From the gym, walk 110° to the canteen.”
Scale Sprint
Give three routes and a bar scale. Students use string or paper strips to measure, convert to meters, and compare estimates to measures. Add travel time by walking speed for a final check.
Contour Detective
Two routes cross a hillside. Which climbs less? Students shade the steeper slopes, sketch a cross-section with the interval given, then justify the choice in two sentences. USGS examples help with clean visuals.
Grid Reference Hunt
Place tokens at six-figure spots on an OS extract. Teams swap and verify with a transparency. Use OS Mapzone for a quick refresher if accuracy drops.
Projection Showdown
Groups compare Mercator with an equal-area design for a public info poster. Each group states the purpose, names the projection, and lists one trade-off. Use the orange-peel demo from the NG activity to ground the talk.
Ethics and Source Quality in Map Use
Every map is a set of choices: projection, classification, color, symbol weight, data date. Build habits that keep products honest:
-
Add a source line and date on every student map.
-
Note one limitation under the legend.
-
Pick projections and class breaks with the task in mind, not for effect.
The current subject reports and reviews stress curriculum coherence, clear expectations for fieldwork, and explicit teaching of disciplinary habits like these.
Why This Mix Works (and lasts)
-
The skill set grows step by step under a national standards spine.
-
Teaching moves match how memory works: less clutter, more practice.
-
Spatial skill improves with training, so regular drills pay off.
-
Fieldwork and digital tools add relevance when used for a clear purpose.
-
Reliable open resources keep prep time reasonable: RGS map-skill lessons, OS Mapzone practice, USGS topographic tasks, NG projection activities.
FAQ-Ready Misconception Fixes
-
Scale confusion: start with a bar scale, then move to ratios, and always ask for an estimate before any measure for number sense.
-
Grid slips: repeat the “along, then up” line and add peer checks with overlays.
-
Contour panic: return to the model and cross-section before a new topographic tile. USGS classroom resources help reinforce the link between lines and landforms.
-
Projection myths: set a purpose first, then pick a projection and declare the trade-off in a caption. The NG activity is a clear entry point.
Conclusion
Map skills take root when lessons are focused and sequenced. Teach one idea at a time, keep displays clean, and revisit core moves daily. Blend paper maps, local fieldwork, and simple web tools so learners move from reading to reasoning.
Build small habits—source lines, scale checks, honest legends—that help students treat every map as evidence. Over a term, confidence grows; over a year, students can argue from maps with clarity.
FAQs
What is a simple way to start map reading with younger learners?
Begin with the school grounds. Create a sketch map with a few agreed symbols, label key places, and use a simple bar scale for short routes. Keep it short and hands-on, then repeat weekly.
How do I teach six-figure grid references without confusion?
Use the phrase “along, then up,” place a transparent grid over the map, and practice with short hunts. OS Mapzone offers quick, game-like refreshers when accuracy dips.
Do I need GIS for strong map skills?
Paper maps still matter. Add web maps or entry-level GIS when you have a clear task, like plotting safe routes or mapping travel modes. Research points to medium gains when geospatial tools are used with tight scaffolds.
How can I check progress without long tests?
Use a three-item warm-up daily, one hinge question mid-lesson, and an exit ticket. Mix old and new items each week to support long-term memory. EEF reviews describe these strategies in plain terms.
Where can I find reliable classroom resources for map skills?
Try RGS year-by-year lessons, OS Mapzone for grid practice, USGS topographic activities, and National Geographic’s projection tasks. These sources are updated and classroom-focused.