

Kathmandu Metropolitan's Air Quality Dashboard Now Live
Kathmandu Metropolitan City has officially launched a real-time air quality monitoring dashboard, which provides up-to-date data from air quality sensors installed across the city.
The new system, called the Kathmandu Metropolitan Air Quality Monitoring Dashboard, was introduced on the occasion of World Environment Day.
Real-Time Air Quality Status from 18 Locations
The dashboard displays PM 2.5 values and air quality index (AQI) levels from 18 different points across the metropolitan area. It allows citizens to see the air quality status of specific locations in real time, helping them stay informed about the environment around them.
Accessing the Dashboard via the KMC Website
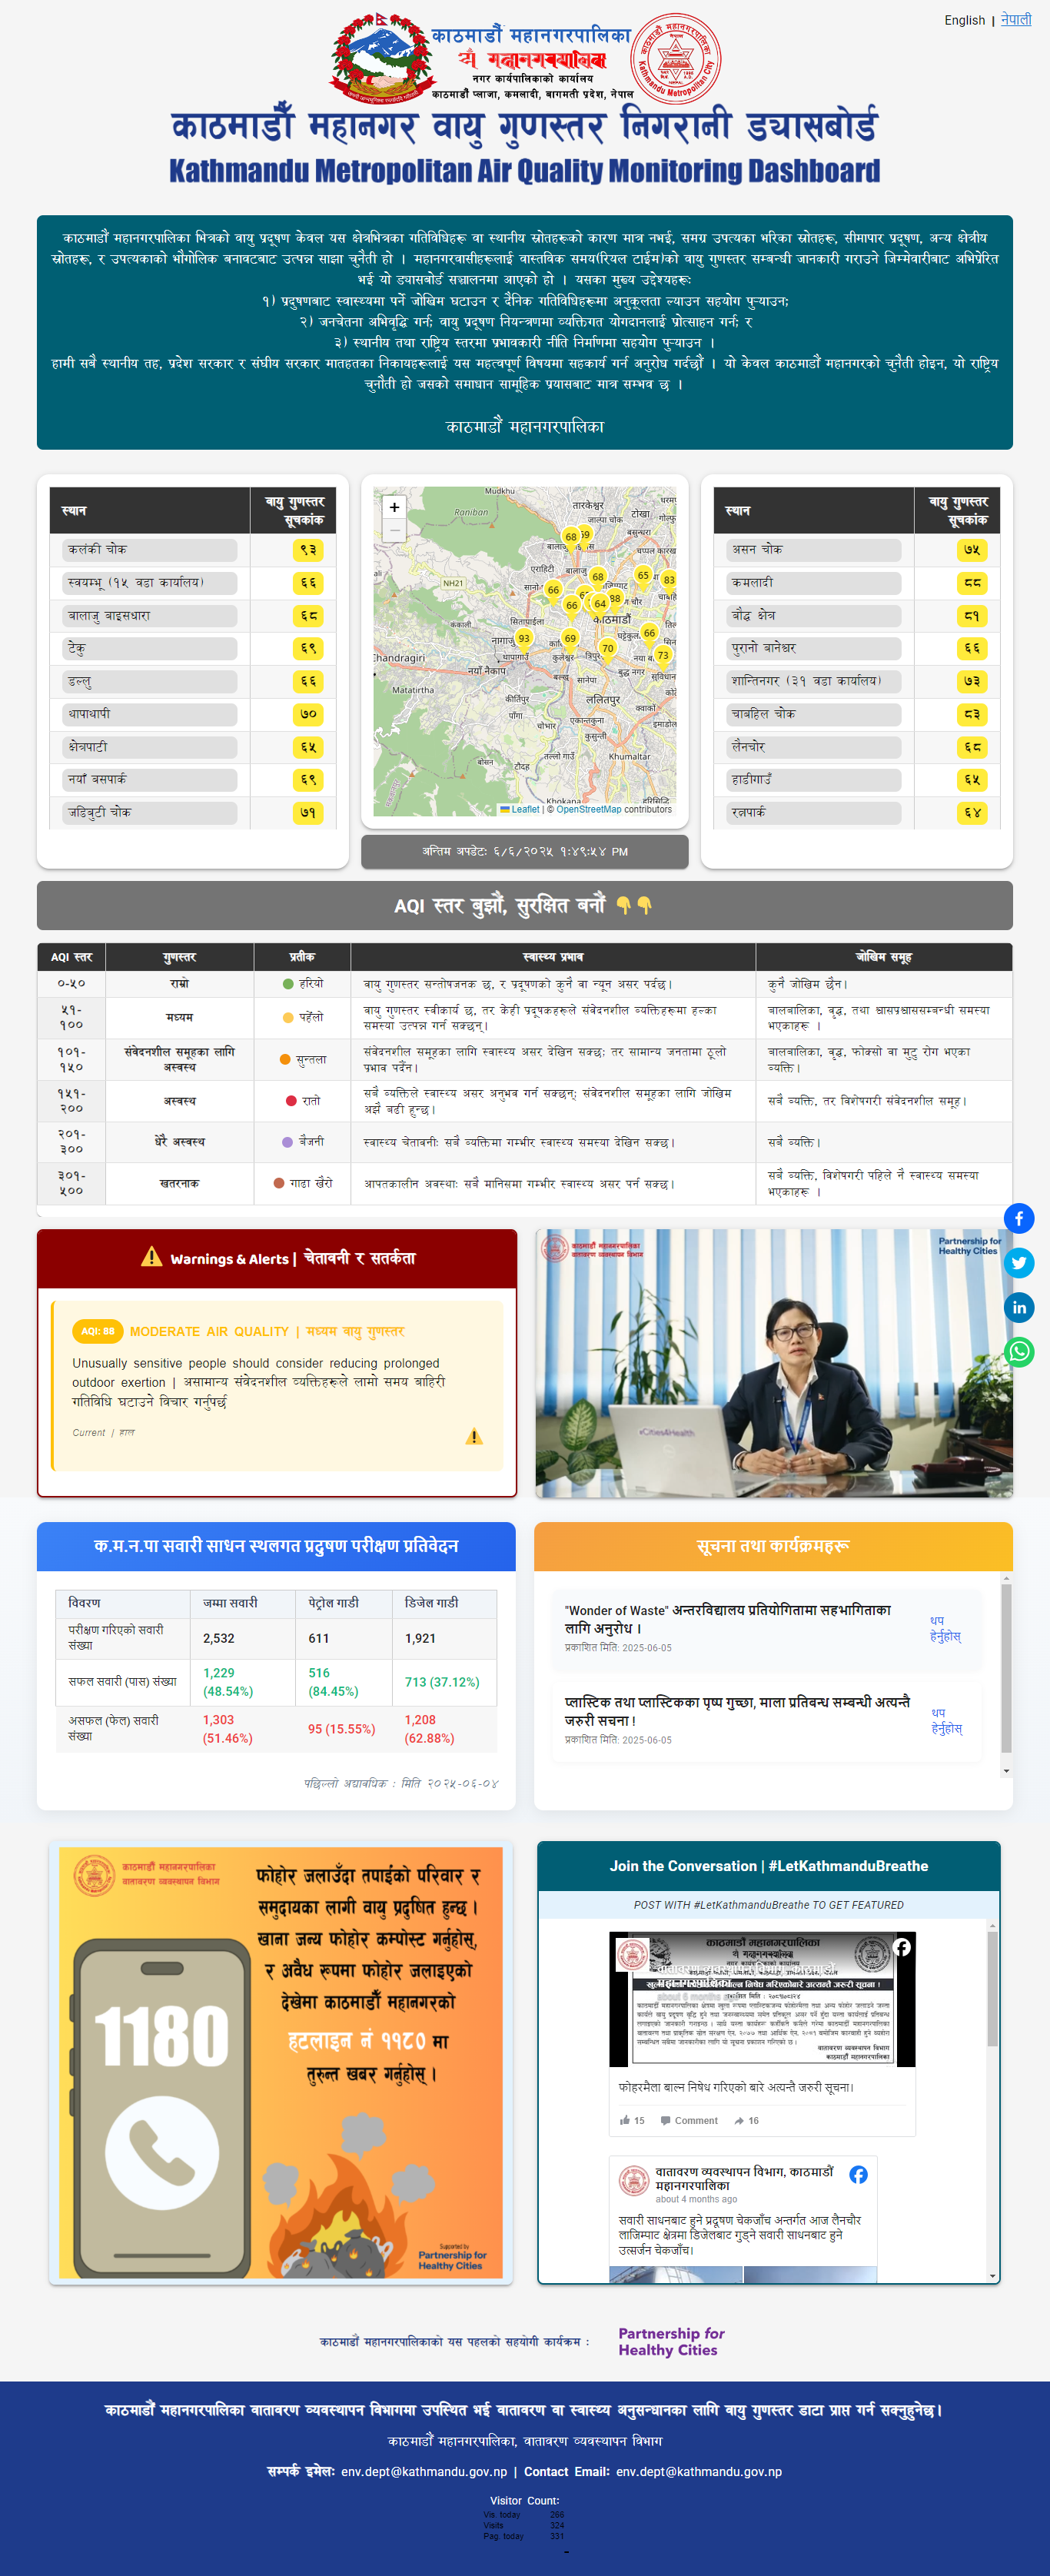
The dashboard can be accessed by visiting Kathmandu Metropolitan City’s official website. From the homepage, users can click on the "Air Quality Monitoring" icon under the citizen services section to view the data. The homepage features site names, corresponding AQI levels, and a map view.
Color-Coded Air Quality Indicators
The AQI levels are represented using six different colors:
-
Green: Good
-
Yellow: Moderate
-
Orange: Sensitive – may affect children, the elderly, and those with heart or lung conditions
-
Red: Unhealthy for all – precautions recommended for everyone
-
Purple: Very unhealthy – serious health impacts for all individuals
-
Maroon: Hazardous – high risk, especially for people with existing health issues
Purpose and Use of the Dashboard
Sarita Rai, head of the Environment Management Division, stated that the goal is to help citizens adjust their lifestyle based on current air quality levels. She explained, “The system provides real-time environmental data, allowing individuals to adapt their behaviors accordingly.”
According to Dr. Deepak Kumar K.C., head of the Health Department, the dashboard data will support policy planning, budgeting, and programming aimed at addressing urban public health issues.
Key Features of the Dashboard
Engineer Sanjib Pandey, project lead of the Healthy City Network initiative, highlighted that the dashboard consists of seven main sections. The most important feature is real-time monitoring through equipment installed in 18 different urban locations.
Educational materials explaining the air quality index and its significance are also included. A color-coded chart provides health safety guidance, while another section presents awareness videos about air pollution. Users can also view the progress of vehicle pollution inspections.
Historical and Hourly Data Availability
The dashboard shows hourly PM 2.5 values and retains data from the past 7 days. Older data can be obtained from the Environment Management Division of the metropolitan office.
Locations with Installed Air Quality Monitoring Devices
Air quality sensors have been installed in the following locations:
-
Chhetrapati Hospital
-
Lainchaur
-
Kalanki Chowk
-
Balaju Baisdhara Park
-
Paropakar Maternity Hospital
-
Thapathali
-
Kathmandu Metropolitan Police Force Regional Office, New Bus Park
Additional sensor locations include:
-
Thulo Bharyang, Chakrapath
-
Boudha
-
Ratna Rajya Secondary School
-
Mid Baneshwor
-
Teku Transfer Station
-
Ward No. 27 Office
-
Pashupati Mitra Secondary School, Chabahil
-
Medicinal Herb Production and Processing Company Office, Jadibuti
-
Ward No. 5 Office, Narde
-
Ward No. 23 Office, Om Bahal
-
Urban Health Promotion Center of Ward No. 1, Naxal
-
Ward No. 31 Office Premises
Technology and Data Collection
These devices use Clarity Node–S air quality sensors, which provide real-time PM 2.5 data. The devices are powered by solar energy and the data is instantly transferred to the metropolitan dashboard.
Website to check: https://kathmandu.gov.np/kmc-air-quality-monitoring
Kathmandu